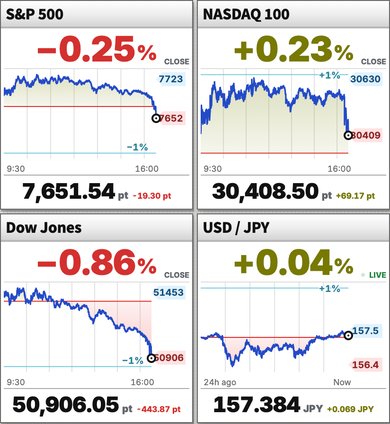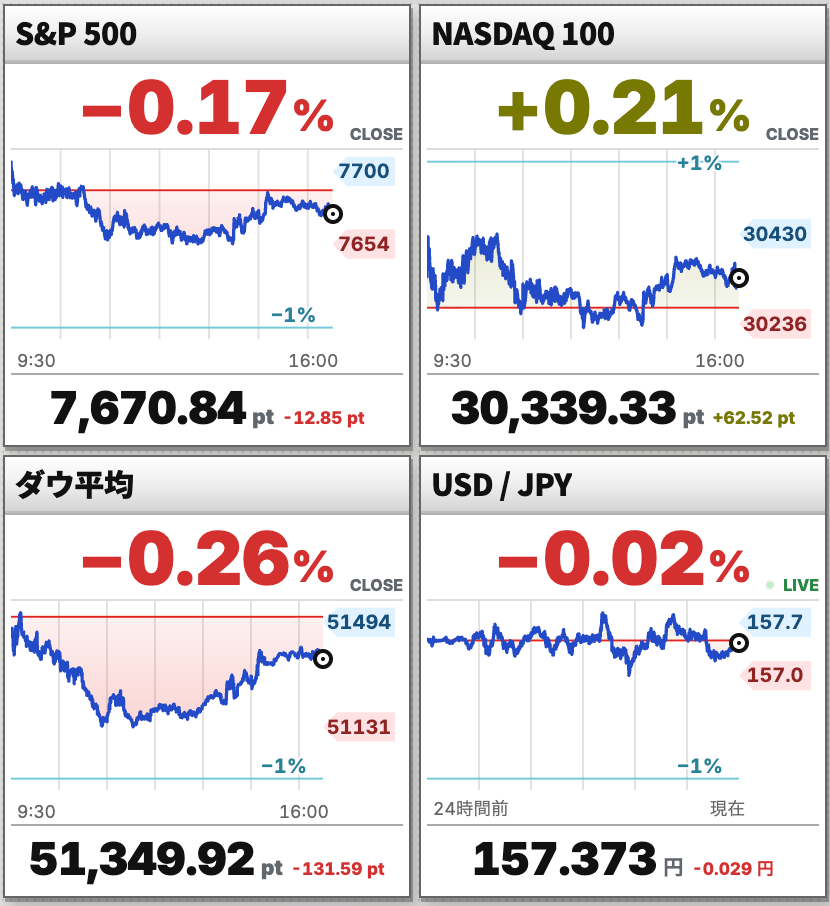
Major U.S. indexes diverged on September 29. The S&P 500 closed at 7,670.84, down 0.17%, and the Dow fell 0.26% to 51,349.92. The Nasdaq 100, by contrast, rose 0.21% to 30,339.33. After all three indexes declined the previous session, the technology-heavy Nasdaq 100 posted a modest rebound.
The Associated Press reported that renewed increases in long-term U.S. Treasury yields weighed on equities. The 10-year Treasury yield reached 5.25%, keeping inflation and the outlook for interest rates in focus alongside oil-price swings. Brent crude fell 1.7% to settle at $96.16 a barrel, though it remained elevated. The AP also reported that Nvidia gave up an early gain to finish down 0.7%, while Broadcom rose 1.6%.
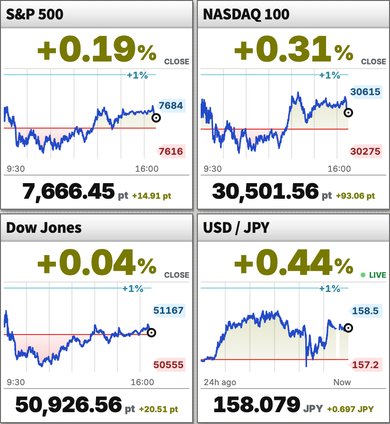
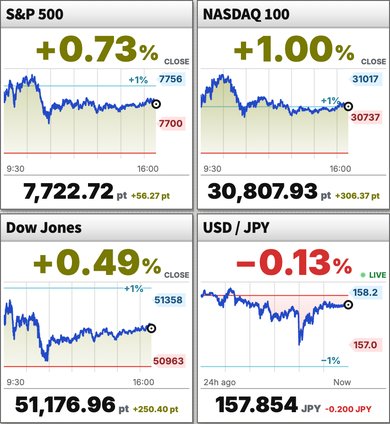
On this site's charts, the S&P 500 and Dow extended losses during the session before recovering somewhat late in the day, but both finished lower. The Nasdaq 100 also traded below its previous close at times before recovering toward the end. The market did not move in one direction across the board; differences among indexes and stocks stood out.
Selling around 11 a.m., renewed buying from 2 p.m.
The S&P 500 initially trades near its previous close, then weakens at approximately 11–11:30 a.m. Eastern time. The Nasdaq 100 also surrenders its early gain and trades below its baseline after noon. The Dow remains low through the midday period following its morning decline. All three recover at roughly 2–3 p.m., but only the Nasdaq 100 regains positive territory. The recovery is shared; its strength is not.
Elevated Treasury yields press on equity valuations, while falling oil offers relief from inflation concerns. Those competing influences fit selective buying after declines rather than a broad decision to increase exposure everywhere. Renewed interest in large companies with stronger growth expectations is consistent with the Nasdaq 100 alone ending higher. This was a targeted rebound within a high-rate environment, not a market-wide dismissal of the rate headwind.
The Nasdaq Composite and Nasdaq 100 are different measures
When index changes are modest, the choice of index still matters. The Nasdaq 100 concentrates on large nonfinancial companies and differs from the Nasdaq Composite. The chart and closing table here use the Nasdaq 100. The more accurate reading is that part of the large-growth segment recovered more strongly than other benchmarks, not that the entire U.S. market rebounded. Confusing those indexes could lead to a mistaken conclusion about participation.
Nor did the recovery from the 2 p.m. hour extend uninterrupted into the close; some gains faded late. The charts show renewed demand, but not yet the establishment of a durable upward trend. The next tests are whether the recovered afternoon range holds from the opening and whether buying extends to the S&P 500 and Dow. USD/JPY shows comparatively limited fluctuations over its rolling window, making one dramatic currency event a poor explanation for the contrast between morning and afternoon stocks. Selection within equities, alongside the competing influence of oil and rates, provides the more useful interpretation.
Major Index Closes
- S&P 5007,670.84 −0.17%
- Nasdaq 10030,339.33 +0.21%
- Dow Jones Industrial Average51,349.92 −0.26%