Financial news says “the Nasdaq rose,” while funds promise exposure to the “Nasdaq 100.” These are not the same index. The Composite covers a broad Nasdaq-listed equity universe; the Nasdaq 100 selects large non-financial companies. Watching both reveals relative strength within a market whose headline charts often look almost identical.
1971: an index to describe the Nasdaq market
The Nasdaq Composite launched on February 5, 1971, alongside the development of Nasdaq’s electronic stock market. Its role is to describe that market broadly, rather than select only its largest businesses. Eligible Nasdaq-listed equities include domestic and international companies, spanning different company sizes.
“Composite” does not mean all U.S. stocks. The boundary is a listing venue: companies listed only on the NYSE are outside it. The Composite, S&P 500 and total U.S. stock market therefore represent different ways to define an equity universe.
1985: separating large non-financial businesses
The Nasdaq 100 launched on January 31, 1985, alongside the Nasdaq Financial-100. It did not replace the Composite. It separated large non-financial companies into a distinct benchmark, useful for comparing that group and building financial products around it. One index describes the wider exchange; the other selects a large-company segment.
QQQ’s launch in 1999 broadened access to that segment. The Nasdaq 100 is not a list of 100 pure technology companies: consumer and healthcare businesses also qualify. Its technology-heavy character follows from its eligibility rules and the growth of its constituent businesses.
Compare selection rules as well as company counts
| Feature | Nasdaq 100 | Nasdaq Composite |
|---|---|---|
| Launch | January 31, 1985 | February 5, 1971 |
| Scope | 100 large non-financial companies | Thousands of eligible Nasdaq-listed equities |
| Size | Large caps | Large, mid and small caps |
| Financials | Excluded | Included |
| Industries | Technology-heavy, also consumer and healthcare | Technology-heavy, broader industry and size coverage |
| Weighting | Modified market capitalization | Market capitalization |
| Purpose | Large non-financial benchmark and investment exposure | Broad view of the Nasdaq equity market |
The 100 refers to the index’s basic company-count design. Multiple share classes and current addition rules mean the security count need not equal exactly 100 at every moment. Composite membership changes with listings and delistings. The more useful distinction is selection: large non-financial companies versus a broad eligible Nasdaq-listed universe.
Thousands of holdings do not mean equal weighting. The Composite weights by market capitalization, so giant businesses still dominate. The Nasdaq 100 modifies capitalization weights to address concentration. Neither the number of names nor the label “Composite” alone tells you the weight of its largest company.
Twenty-six years: similar directions, different outcomes
We matched 6,539 sessions from the first trading day of 2000 through the end of 2025, using NDX and IXIC price indexes in U.S. dollars. Both sides use the same daily-return definition; neither substitutes a dividend-reinvested ETF for the other’s price index.
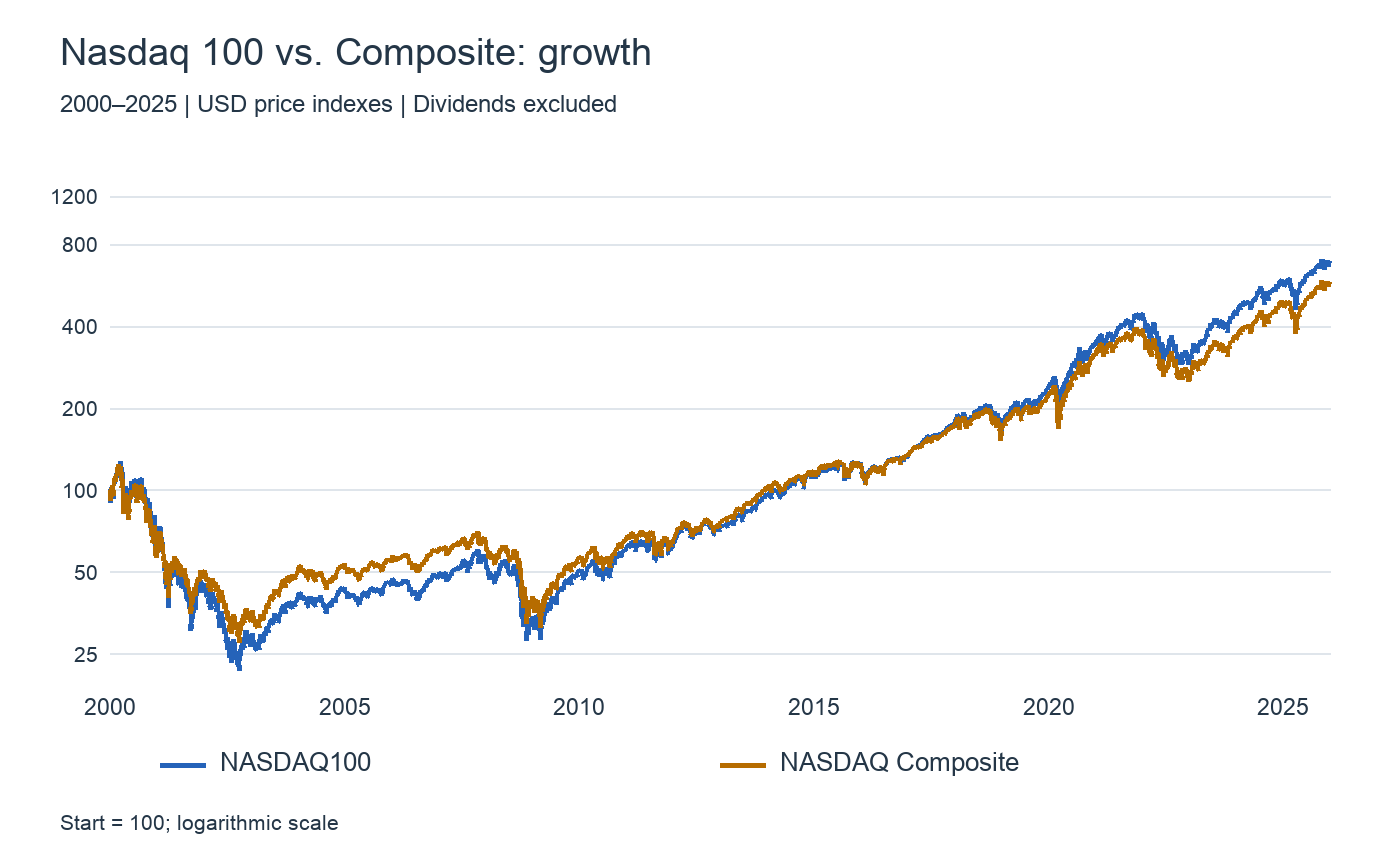
Over the full sample, Nasdaq 100 CAGR was 7.66%, versus 6.93% for the Composite. Annual volatility was 27.35% and 24.91%; Sharpe ratios were 0.337 and 0.318. The Nasdaq 100 delivered more growth and more variation. Its advantage in risk-adjusted efficiency was smaller than its advantage in compounded return.
| Period | Index | CAGR | Annual volatility | Sharpe | Maximum drawdown |
|---|---|---|---|---|---|
| 2000–2025 | NASDAQ100 | 7.66% | 27.35% | 0.337 | -82.90% |
| 2000–2025 | NASDAQ Composite | 6.93% | 24.91% | 0.318 | -77.93% |
| 2000–2009 | NASDAQ100 | -6.66% | 35.35% | -0.097 | -82.90% |
| 2000–2009 | NASDAQ Composite | -5.67% | 30.64% | -0.128 | -77.93% |
| 2010–2019 | NASDAQ100 | 16.73% | 17.32% | 0.949 | -22.99% |
| 2010–2019 | NASDAQ Composite | 14.74% | 17.05% | 0.860 | -23.64% |
| 2020–2025 | NASDAQ100 | 19.35% | 25.66% | 0.713 | -35.56% |
| 2020–2025 | NASDAQ Composite | 17.19% | 25.28% | 0.648 | -36.40% |
Daily-return correlation was 0.984 overall: 0.982 in 2000–2009, 0.987 in 2010–2019 and 0.994 in 2020–2025. Holding both is not equivalent to adding an independent market. Their value on a dashboard lies in the difference between two closely related movements.
CAGR measures compounded growth; Sharpe uses arithmetic daily excess returns. When excess returns are negative, dividing by greater volatility can move a negative Sharpe closer to zero. In the 2000s, a higher Sharpe ranking therefore does not mean smaller losses. Read it alongside CAGR and maximum drawdown.
Why the gap? Successful giants and the cost of concentration
In 2010–2019 the Nasdaq 100 returned 16.73% annually, against 14.74% for the Composite, with similar volatility of 17.32% and 17.05%. My reading is that the expansion of giant platform businesses favored the Nasdaq 100’s large-company selection. Including more companies is not automatically a route to a higher return: different allocations accumulate into different compounded outcomes.
In 2000–2009 the picture reversed. CAGR was −6.66% for the Nasdaq 100 and −5.67% for the Composite. Expectations surrounding large growth businesses broke down, and concentration deepened the damage. Full-sample maximum drawdowns reached −82.90% and −77.93%. A design that captures growth is not a design that wins in every era.
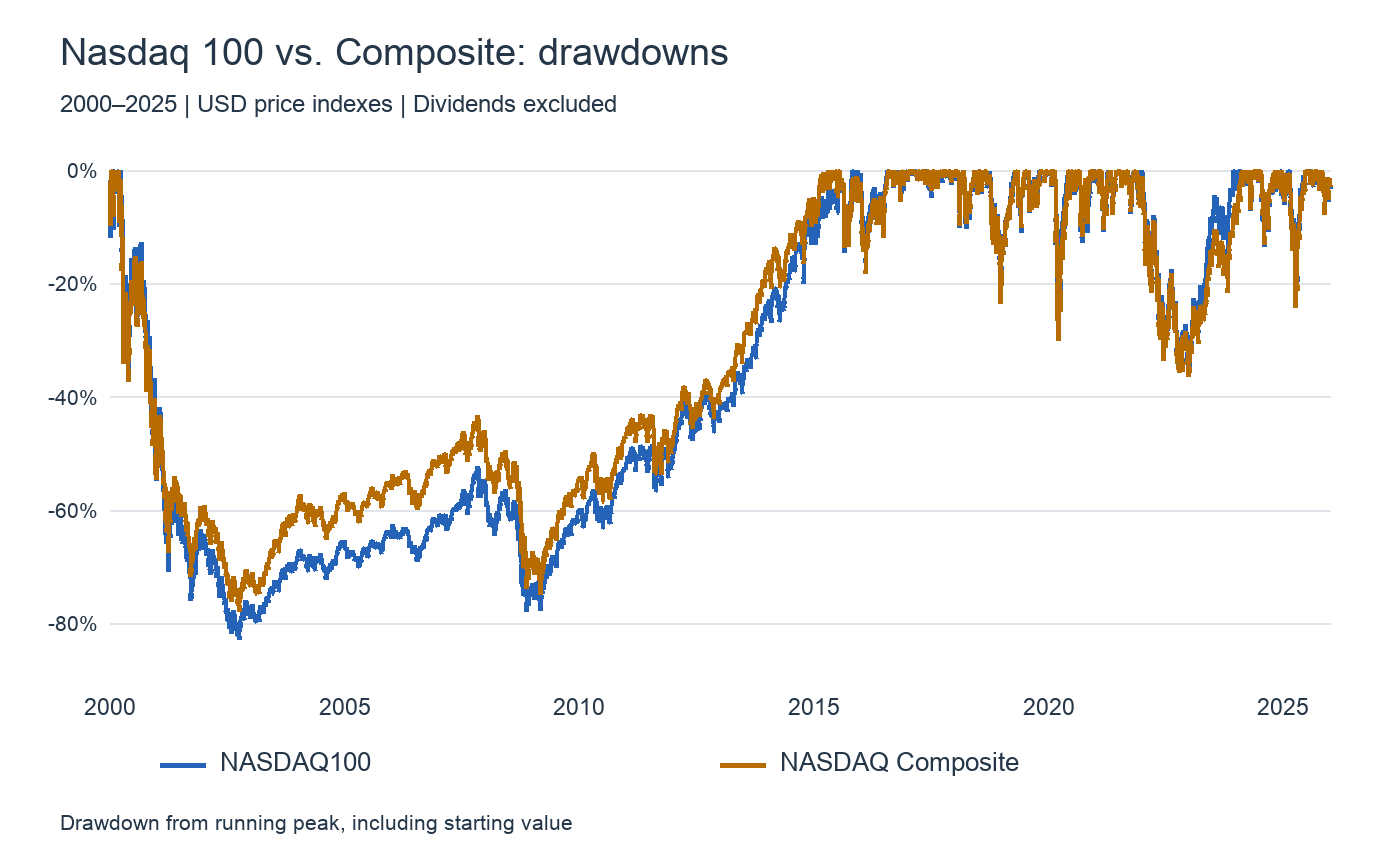
In 2020–2025 maximum drawdown was −35.56% for the Nasdaq 100 and −36.40% for the Composite. The broader universe actually fell slightly further in this window. Company count does not determine safety. Smaller growth companies’ financing conditions and different industry allocations help frame the comparison; this aggregate calculation is not a sector-level attribution of the gap.
Using this board: leadership versus participation
Place the regular Nasdaq 100 and Nasdaq Composite next to each other. Start with their daily percentage changes. Stronger Nasdaq 100 performance highlights large non-financial leadership; stronger Composite performance points to relative strength from its different weights and wider universe. Add semiconductors, major individual companies or financial stocks to investigate where the gap comes from.
Then follow when the gap opens: at the open, after news, or into the close. If both recover but only the Nasdaq 100 reaches a new intraday high, large-company leadership is persisting. If the Composite catches up, investigate wider participation. Capitalization-weighted indexes do not count advancing stocks, so use advance–decline measures to establish breadth itself.
Compare printed percentages and reference lines, not pixel slopes: each chart scales independently. These two regular indexes share U.S. session hours. Introducing Nasdaq 100 CFDs or TQQQ adds different trading hours or leverage, so begin with the two regular benchmarks.
The conclusion: one market thermometer, one large-company lens
The Composite describes a wider Nasdaq market; the Nasdaq 100 focuses the lens on large non-financial businesses. For investing, understand that exposure rather than treating historical leadership as universal superiority. For daily observation, start with the similar shapes and then read the percentage gap. That second step is where the comparison becomes useful.
Data and calculation
December 31, 1999 is the starting close; returns run January 3, 2000 through December 31, 2025. Each era similarly starts from its preceding session’s close. Yahoo Finance NDX and IXIC daily closes give returns as close ratios minus one. CAGR uses elapsed calendar time; annual volatility is the sample daily standard deviation times √252. Sharpe is mean daily excess return divided by its sample standard deviation, times √252.
The risk-free proxy is FRED TB3MS, the U.S. three-month Treasury bill rate. Each session uses the prior month’s annual rate, multiplied by elapsed calendar days divided by 365, avoiding current-month look-ahead. Maximum drawdown includes the starting value in the running peak. These are price indexes: dividends, taxes, currency movements and product expenses are excluded. The table compares index behavior, not take-home fund returns. Calculated October 11, 2026.
Data and references
- Nasdaq — Composite 50th anniversary
- Nasdaq — The Nasdaq-100: Tracking Innovation
- Nasdaq — Nasdaq-100 methodology
- Nasdaq — Composite vs. Nasdaq-100
- Yahoo Finance — NDX daily history
- Yahoo Finance — IXIC daily history
- FRED — TB3MS