SOXL makes semiconductor rallies hard to ignore. It packages the daily movement of an industry associated with AI, data centers and chipmaking equipment into a 3x exposure. The important question is not whether semiconductors can grow. It is whether tripling their daily movements improves the experience of actually holding them.
We model SOX at daily leverage levels from zero to five, with U.S. short-rate financing, using 2000–2025 data. The central result is a 1.73x peak in median annualized three-year returns. Three times sits beyond that peak. Decade-by-decade results explain why a strategy that looked compelling in the 2010s can behave very differently later.
What SOXL actually does
Direxion’s product page gives an inception date of March 11, 2010 and a current objective of 300% of the NYSE Semiconductor Index’s daily performance. A 2021 announcement scheduled a switch from the PHLX Semiconductor Sector Index to the ICE Semiconductor Index around August 25 that year. Today, SOXL is not literally SOX multiplied by three.
The SEC-filed prospectus describes stocks, ETFs, swaps and futures, with exposure rebalanced daily. Futures are not the only mechanism. Three dollars of exposure for each dollar of assets is reset after the day’s movement, rather than remaining a fixed loan against the original investment. This daily reset drives the long-run mathematics.
Compounding rewards trends and penalizes round trips
An index that rises 10% and then falls 9.09% returns approximately to its starting point: 100 → 110 → 100. Daily 3x exposure instead moves 100 → 130 → 94.55, a loss of about 5.45%. At 2x it ends around 98.18. No interest or operating expense is needed to create that difference.
Persistent gains can produce the opposite effect: leveraged wealth grows and participates in the next gain, sometimes exceeding three times the index’s cumulative return. Leverage is not a machine that always decays. It amplifies trends while paying heavily for alternating moves. Semiconductors combine strong growth with large fluctuations, making this distinction particularly important.
Define the median before choosing the leverage
We use the Nasdaq SOX price index, so dividends are excluded. At every month-end, start a hypothetical investment and hold it for 36 months. Annualize that compounded return, then take the median across 277 overlapping windows. This is the middle three-year investor experience, not the median daily return and not the return from a single investment held for 26 years.
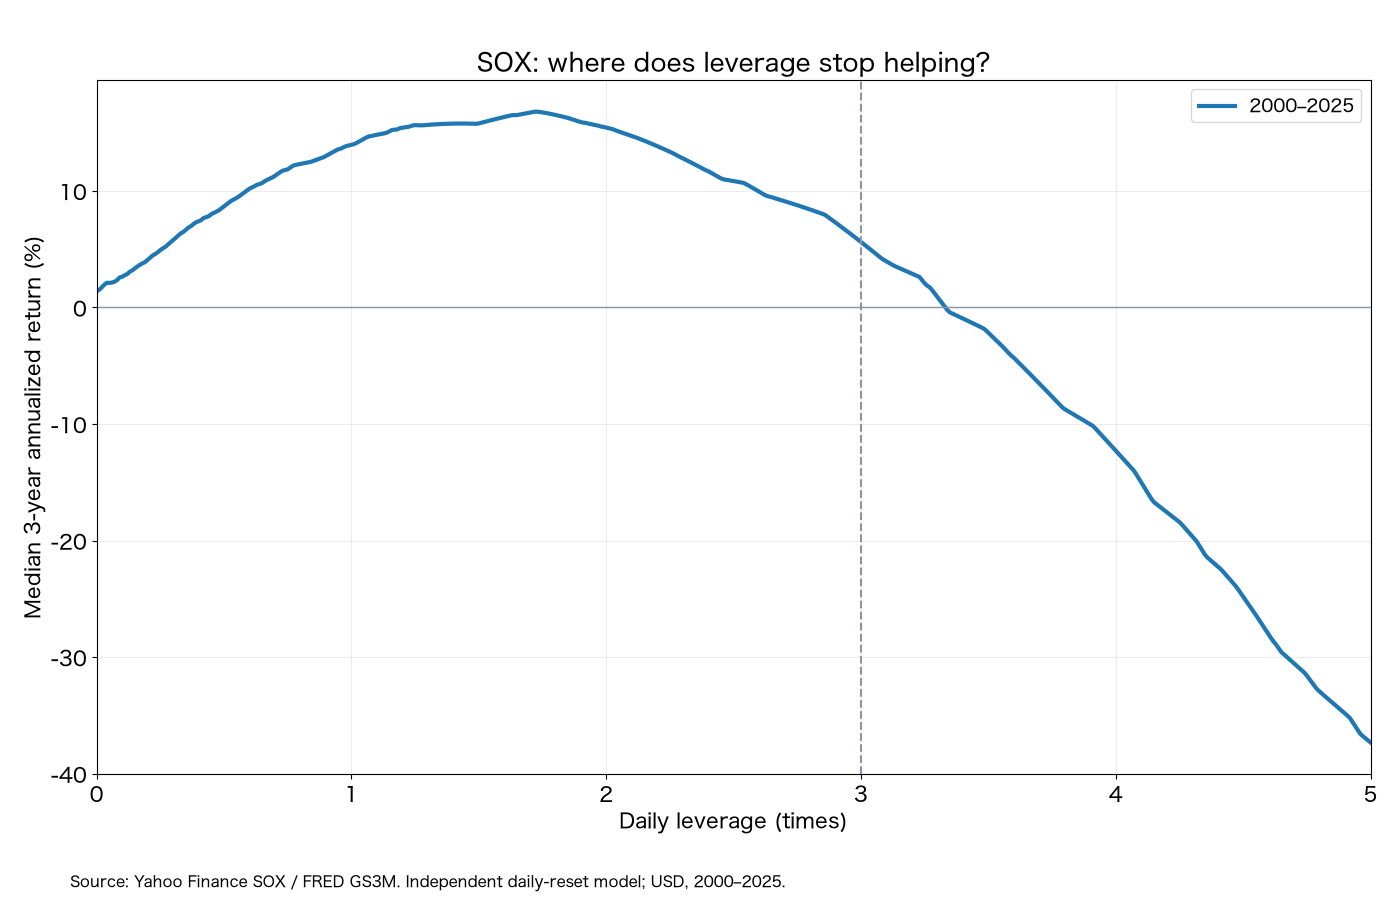
Median annualized returns are 13.96% at 1x, 15.44% at 2x and 5.62% at 3x. The maximum is 16.80% at 1.73x. In this sample and holding horizon, leverage beyond the peak is excessive for the objective of maximizing the median. The curve has small kinks because it takes the median across different paths. The position of the peak matters more than treating its second decimal place as a permanent law.
Different decades give different answers
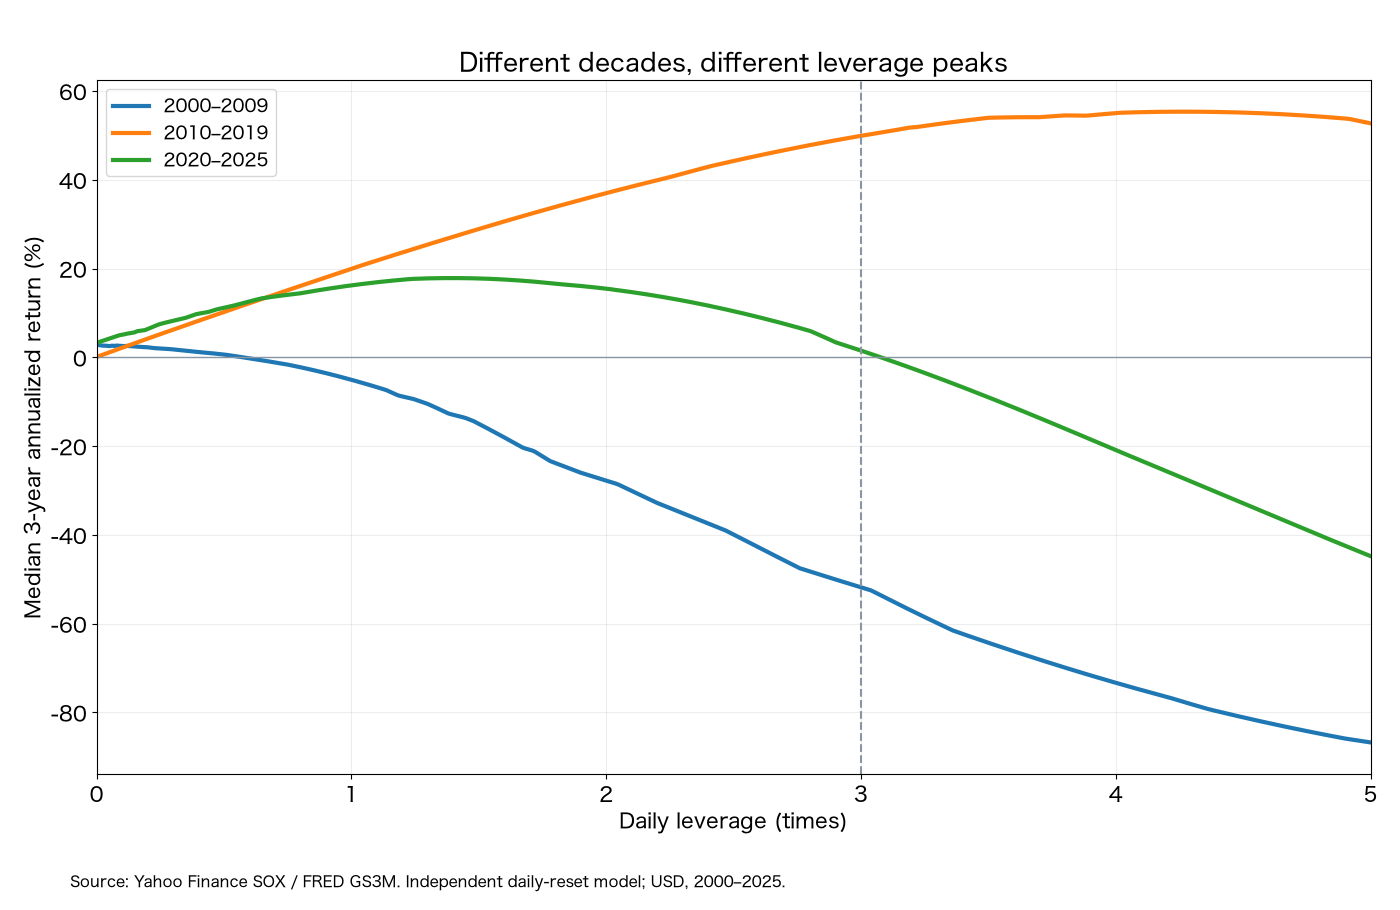
Each era uses only holding windows fully contained within its dates. The 2000s contain the dot-com collapse and financial crisis; the 2010s combine recovery with low rates; the 2020s contain pandemic disruption, tightening and the AI investment boom.
| Period | Peak leverage | Peak median | 1x median | 2x median | 3x median | Windows |
|---|---|---|---|---|---|---|
| 2000–2025 | 1.73× | 16.80% | 13.96% | 15.44% | 5.62% | 277 |
| 2000–2009 | 0.00× | 2.81% | -5.05% | -27.77% | -51.81% | 85 |
| 2010–2019 | 4.27× | 55.35% | 19.98% | 37.00% | 49.91% | 85 |
| 2020–2025 | 1.39× | 17.86% | 16.22% | 15.47% | 1.53% | 37 |
In 2000–2009, the maximum occurs at zero equity leverage: cash earning the model’s short rate. The 3x median is −51.81% a year. Buying a growing industry does not neutralize the purchase price or the consequences of a deep contraction.
In 2010–2019, the peak moves to 4.27x, and 3x earns a median 49.91%. Rising markets and cheap financing make high leverage powerful. But 2020–2025 peaks at 1.39x: the 3x median falls to 1.53%, versus 16.22% at 1x. Strong rally years coexist with poor three-year results when large declines and expensive funding interrupt the path.
The holding horizon changes the answer
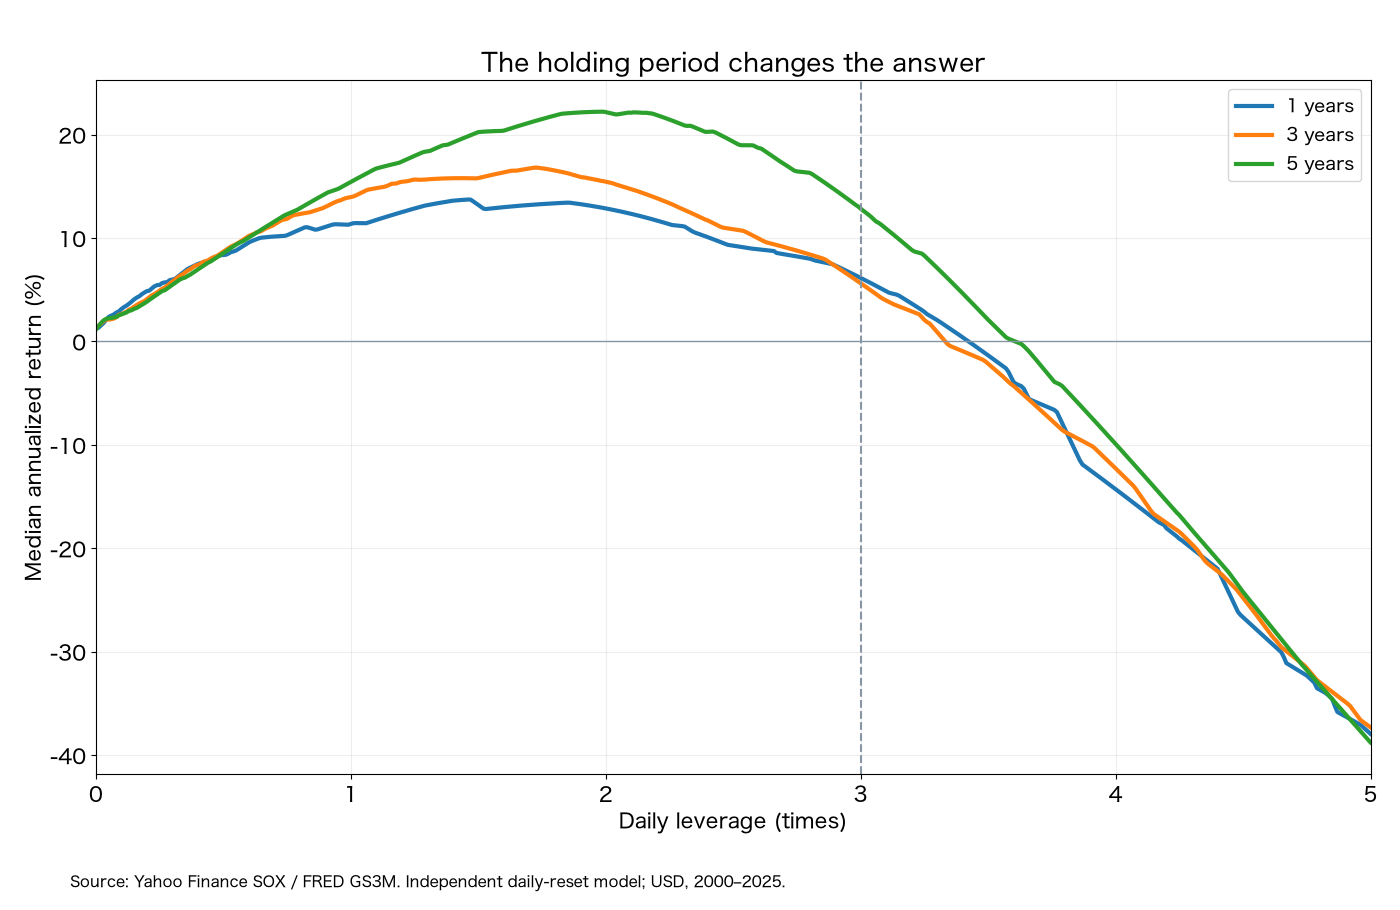
The peaks for one-, three- and five-year holding periods are 1.46x, 1.73x and 1.99x respectively. Longer holdings accumulate both compounding effects and funding charges. Asking “how much leverage?” without specifying “for how long?” leaves out a defining part of the problem. Three years provides a useful bridge between short-term trading and a single starting-date, multi-decade result.
At 5% rates, the extra two dollars are expensive
The daily wealth factor is 1 + L × SOX return − (L − 1) × annual short rate × elapsed days / 365. At 3x, financing applies to the extra 2x exposure. A 5% rate therefore represents roughly 10% of annual funding drag on starting equity before compounding. Futures and swaps embed financing economics; leveraged exposure is not free. Treasury yields provide a consistent proxy, not the exact terms of a swap agreement.
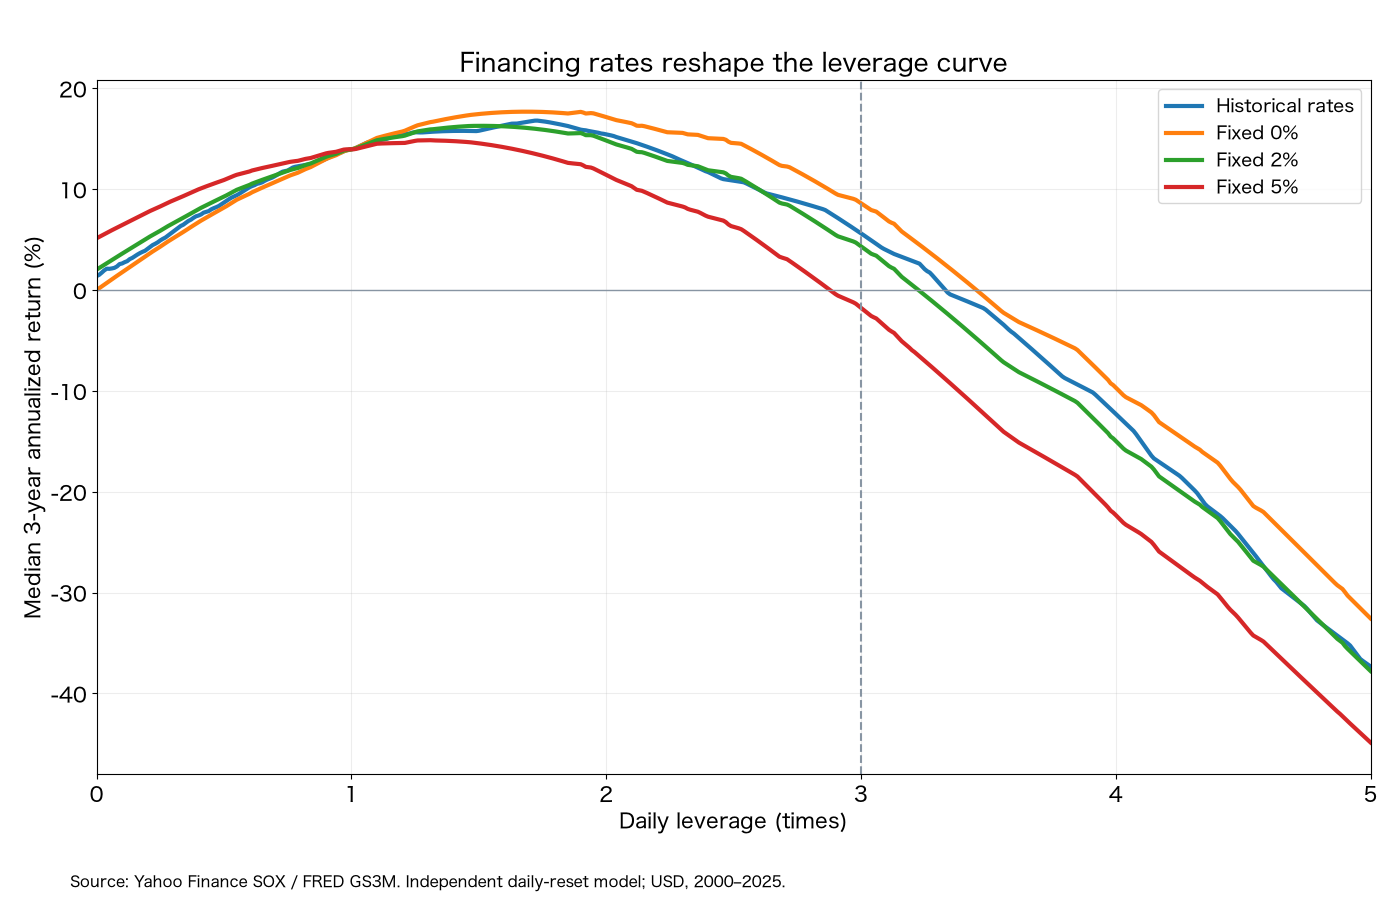
Holding the equity path unchanged, fixed financing rates of 0%, 2% and 5% produce peaks at 1.69x, 1.51x and 1.31x. The price of money changes the answer even when stock returns do not. Below 1x, the uninvested allocation earns the same short-rate proxy.
Operating costs lower the curve further
The current product page lists SOXL’s net expense ratio at 0.75%, with financing-related charges excluded from that headline measure. We add an illustrative annual expense of 0.75% and a 0.50% funding spread on exposure above 1x. This is a cost sensitivity calculation, not a reconstruction of historical SOXL contracts or expense schedules.
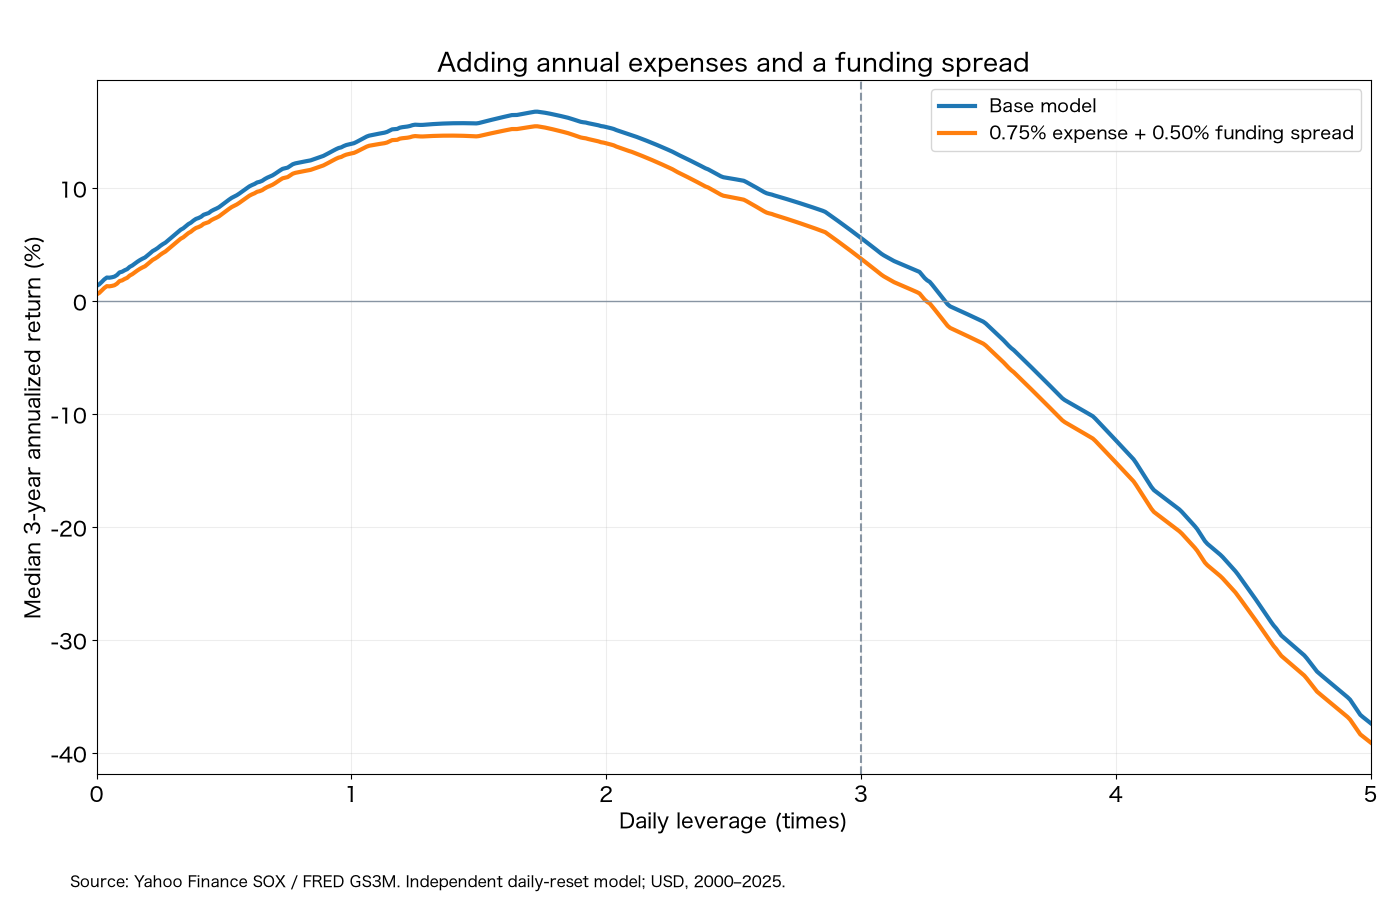
The peak becomes 1.72x with a median annualized return of 15.50%. At 3x the median falls to 3.79%. Looking only at a published operating expense ratio understates the additional burden that grows with leveraged financing.
Drawdowns expose the real difficulty of 3x
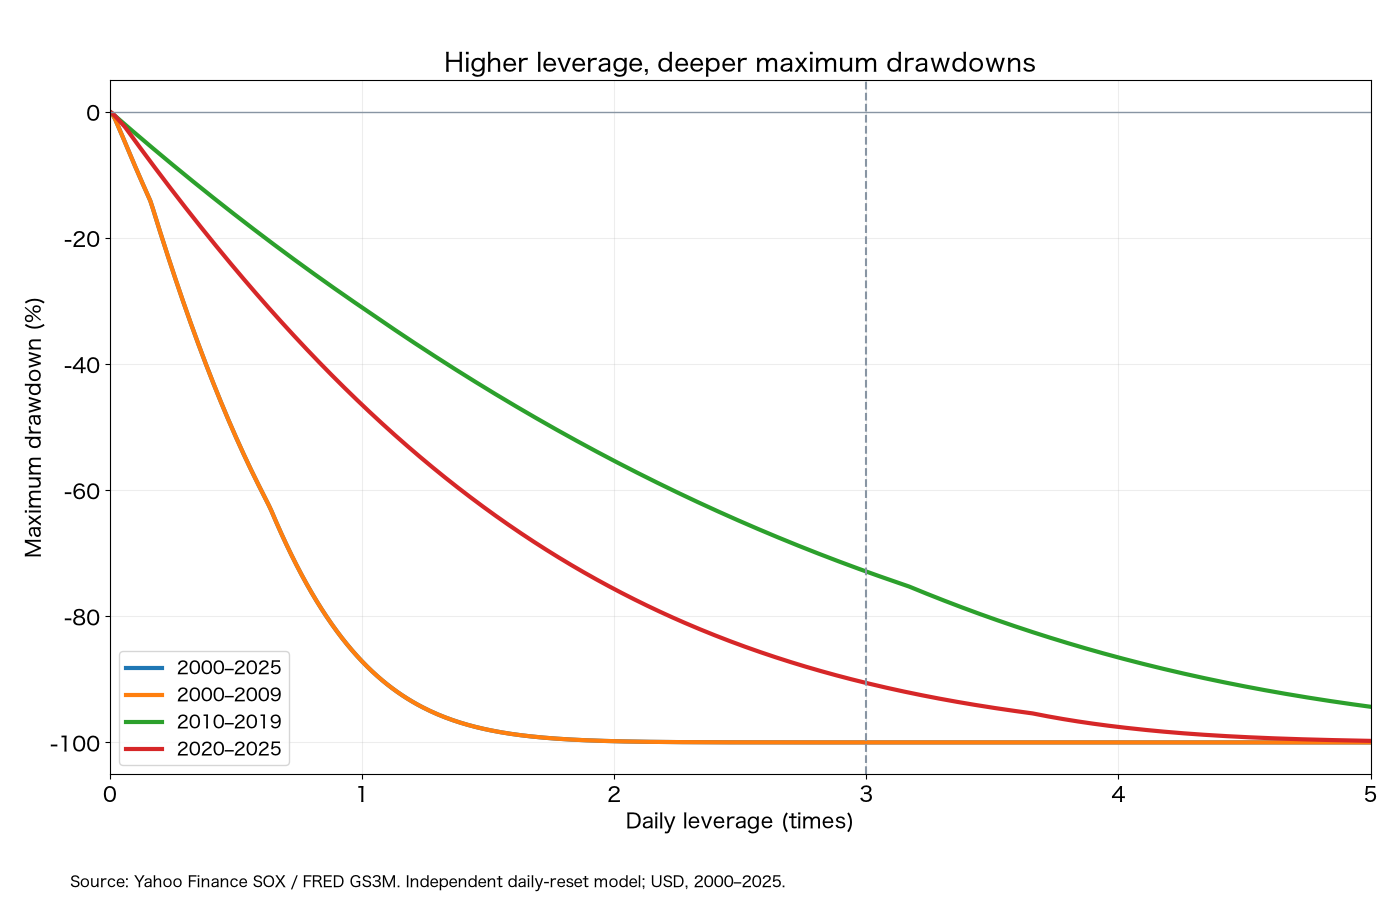
Over 2000–2025, maximum daily drawdowns are −87.15% at 1x, −99.81% at 2x and −99.9996% at 3x. Keeping the extra decimals shows how little capital remains. A 90% loss requires a tenfold recovery; a 99% loss requires one hundred times the remaining capital.
Even in 2020–2025, drawdowns are −46.47%, −75.68% and −90.58% respectively. The semiconductor growth story does not remove the experience of losing nine-tenths of a leveraged position. Actual SOXL distribution- and split-adjusted prices show a maximum drawdown of -90.46% between March 11, 2010 and the end of 2025.
A single investment held through all 26 years compounds at 9.28% annually at 1x, 1.99% at 2x and −17.32% at 3x. A positive median three-year return can coexist with a deeply negative full-period result. Median outcomes, initial timing and worst losses must be read together.
Conclusion: do not make 3x the default
Choose semiconductor leverage from volatility and financing, not growth enthusiasm alone. The three-year median peak is 1.73x across the full sample and 1.39x in the latest era. Three times worked strongly during the 2010s, but not across all environments. My preferred foundation for a long-held semiconductor allocation is unleveraged exposure; any additional leverage should be sized from the loss the overall portfolio can absorb.
An 80% unleveraged semiconductor sleeve and 20% daily-3x sleeve has roughly 1.4x instantaneous industry exposure. Different benchmarks and drifting allocation weights mean this is not identical to a daily-reset theoretical 1.4x fund. It is a way to separate product leverage from portfolio leverage.
Compare SOXL and SOX on this board
Place SOXL beside SOX in a custom tab. A steady upward day feels different from a session that repeatedly reverses direction. Across several days, compound the daily changes rather than multiplying the index’s cumulative return by three. Since SOXL’s benchmark differs from SOX, even a single-day comparison need not be exactly 3:1.
Add Treasury yields to track the rate environment and USD/JPY if measuring wealth in yen. Long-term yields describe a different part of the rate curve from the short-term funding proxy used here. Daily charts explain the movements; the allocation curves put a scale on the losses before choosing a multiplier.
Data and calculation details
Yahoo Finance supplies SOX closes and adjusted SOXL prices. FRED GS3M supplies monthly three-month Treasury yields quoted on an investment basis. Each month uses the preceding month’s rate, with interest accruing over calendar days, including weekends and holidays. We do not reconstruct vintage, unrevised rate releases. Leverage is reset daily on a 0.01 grid from 0x to 5x, in dollars, without new contributions. Median returns use month-end, 36-month compounded holding windows; drawdowns use daily peaks. Era windows remain entirely within each era. Overlapping windows are not independent observations.
The base model excludes dividends, taxes, transaction expenses, operating expenses and funding spreads; the separate cost chart adds the stated assumptions. Actual adjusted SOXL prices include distributions and product-level expenses. The SOX model is not spliced into an invented SOXL history. Every daily model factor remains positive over the tested leverage grid.
Data and references
- Direxion: SOXL product specifications
- Direxion: 2021 benchmark change
- SEC: SOXL summary prospectus (2024)
- Nasdaq: SOX index
- FRED: 3-month Treasury investment yield
- Yahoo Finance: SOX history
- Yahoo Finance: adjusted SOXL history