What belongs beside stocks? Bonds are the traditional answer, gold is often described as crisis protection, and Bitcoin offers exposure to a growing digital asset market. All three sit outside equities, but they perform very different jobs.
We use VTI as the U.S. equity base and compare BND, gold through GLD, and spot Bitcoin over 2015–2025. Gold improved efficiency while reducing volatility. BND exchanged equity exposure for smaller fluctuations. Bitcoin added growth and risk rather than defensive protection. Bitcoin nevertheless produced the highest full-sample portfolio Sharpe ratio. The useful question is not a single ranking, but which characteristic you want to improve.
From balanced funds to gold and digital assets
Mixing equity growth with bond income has a long history. Wellington Fund began operations on July 1, 1929, according to its official report. Harry Markowitz’s 1952 “Portfolio Selection” established a framework for evaluating entire portfolios, including asset correlations, rather than judging holdings in isolation.
Equities and bonds generate business earnings or interest. Gold generates no interest and has long been discussed as a monetary, inflation and crisis diversifier. The industry body World Gold Council highlights its changing relationship with equities across market conditions. Here we test the observed correlations and portfolio outcomes rather than assume that description guarantees protection.
Bitcoin’s returns depend heavily on expectations for adoption, not the cash flows of a conventional stock or bond. BlackRock’s December 2024 analysis considered a 1–2% allocation for investors who accept substantial volatility and expect adoption, emphasizing risk contribution rather than dollar weight. Its reference portfolio was 60/40; that is a different calculation from our VTI-based two-asset study.
Why BND and GLD?
BND provides broad U.S. investment-grade bond exposure, including Treasuries, corporate bonds and mortgage-related securities. It represents the broader bond market here, unlike TLT’s specialized long-Treasury exposure. Gold is represented by the gold-backed GLD ETF, and Bitcoin by BTC/USD spot prices. We calculate three separate portfolios—VTI/BND, VTI/GLD and VTI/BTC—not a joint four-asset optimization.
Gold has the lowest correlation—but correlation is only half the story
| Period | VTI / BND | VTI / GLD | VTI / BTC |
|---|---|---|---|
| 2015–2025 | +0.39 | +0.05 | +0.36 |
| 2015–2020 | +0.06 | -0.01 | +0.28 |
| 2021–2025 | +0.64 | +0.12 | +0.51 |
| 2022 | +0.68 | +0.20 | +0.57 |
Full-sample monthly correlations with VTI were +0.39 for BND, +0.05 for GLD and +0.36 for Bitcoin. Gold’s near-zero relationship stands out as a diversification ingredient. Bitcoin was not perfectly aligned with stocks either, but its own annualized volatility was 74.74%, versus VTI’s 15.39%. Low correlation alone does not make an asset a stabilizer.
Portfolio variance is σₚ² = (1−w)²σstock² + w²σpartner² + 2w(1−w)ρσstockσpartner. Both correlation and each asset’s volatility matter. A large partner volatility can overwhelm a modest correlation. BND reduces fluctuations despite positive correlation because its own volatility was just 5.02%.
A 20% allocation reveals the three roles
| Portfolio | Volatility | CAGR | Sharpe | Max drawdown |
|---|---|---|---|---|
| VTI 100% | 15.39% | 12.91% | 0.74 | -24.82% |
| VTI 80% + BND 20% | 12.73% | 10.81% | 0.72 | -22.73% |
| VTI 80% + GLD 20% | 12.78% | 13.11% | 0.88 | -21.74% |
| VTI 80% + BTC 20% | 22.50% | 26.47% | 1.08 | -34.18% |
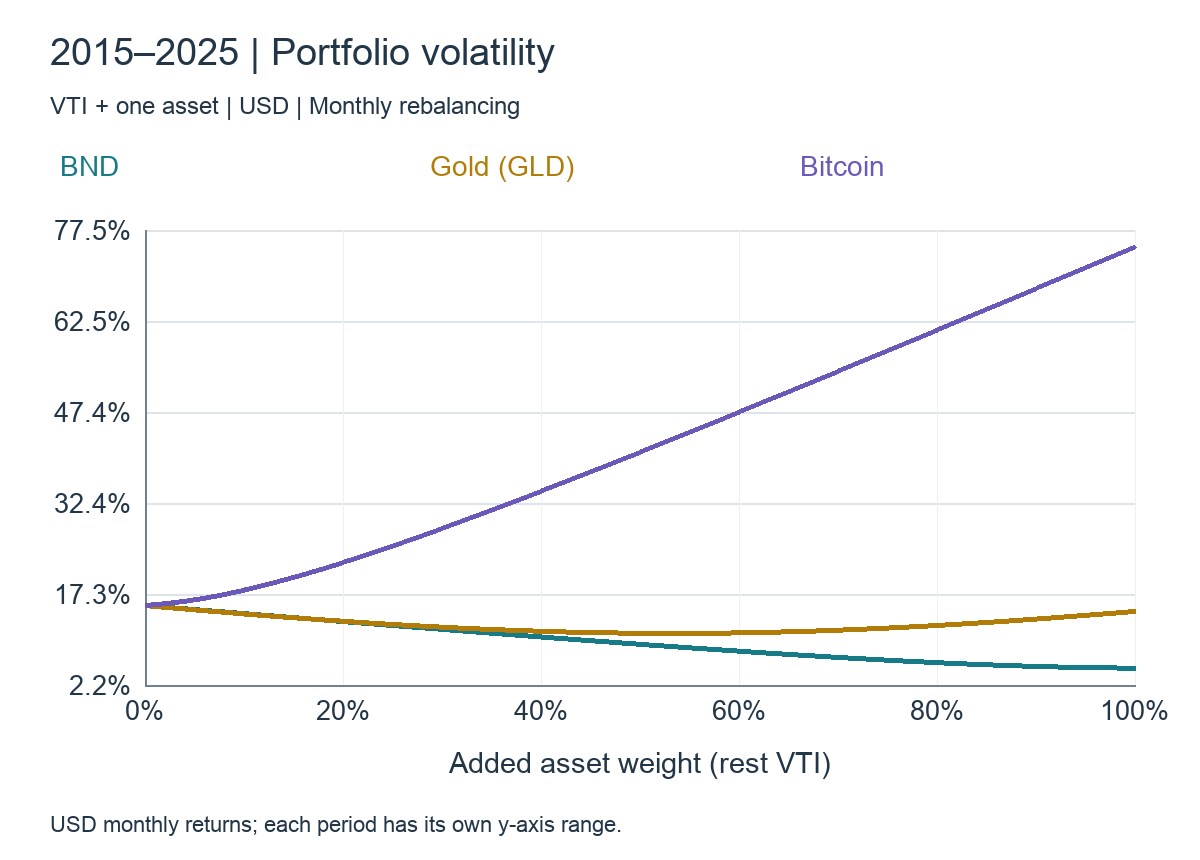
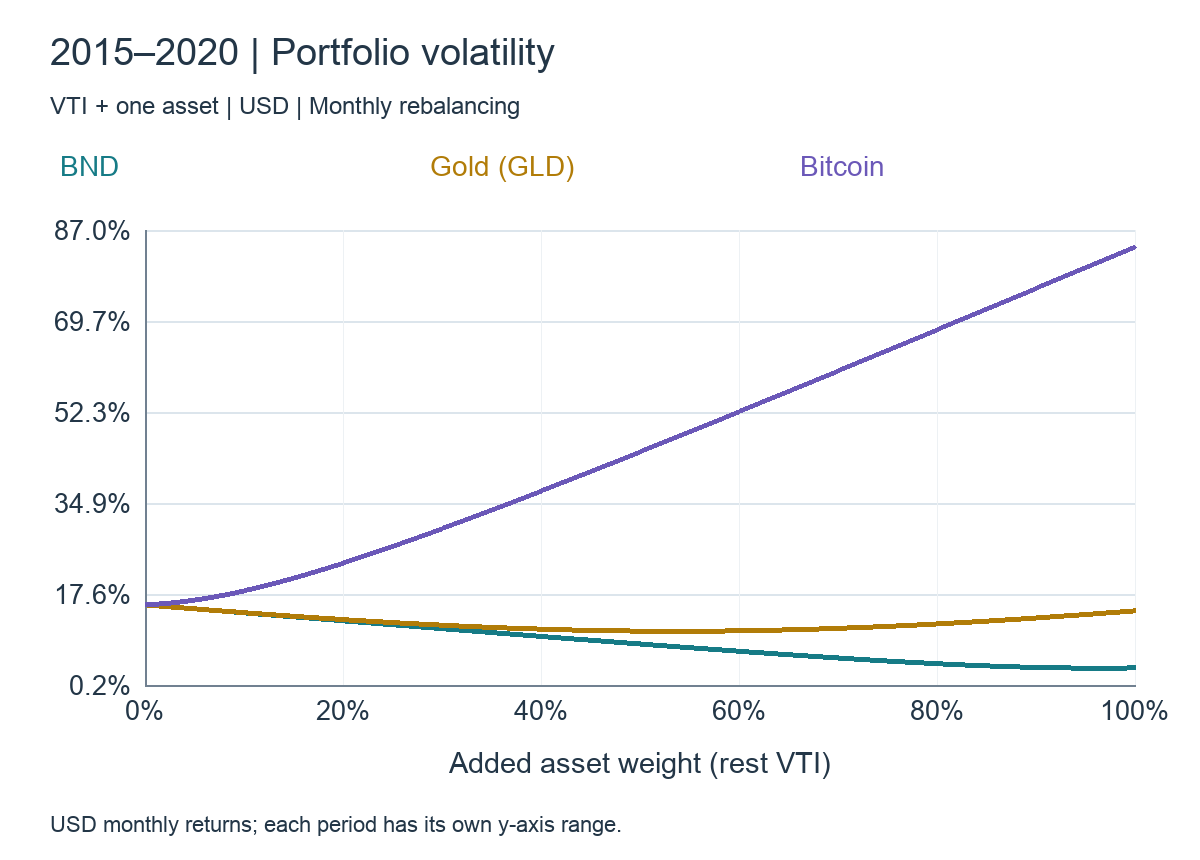
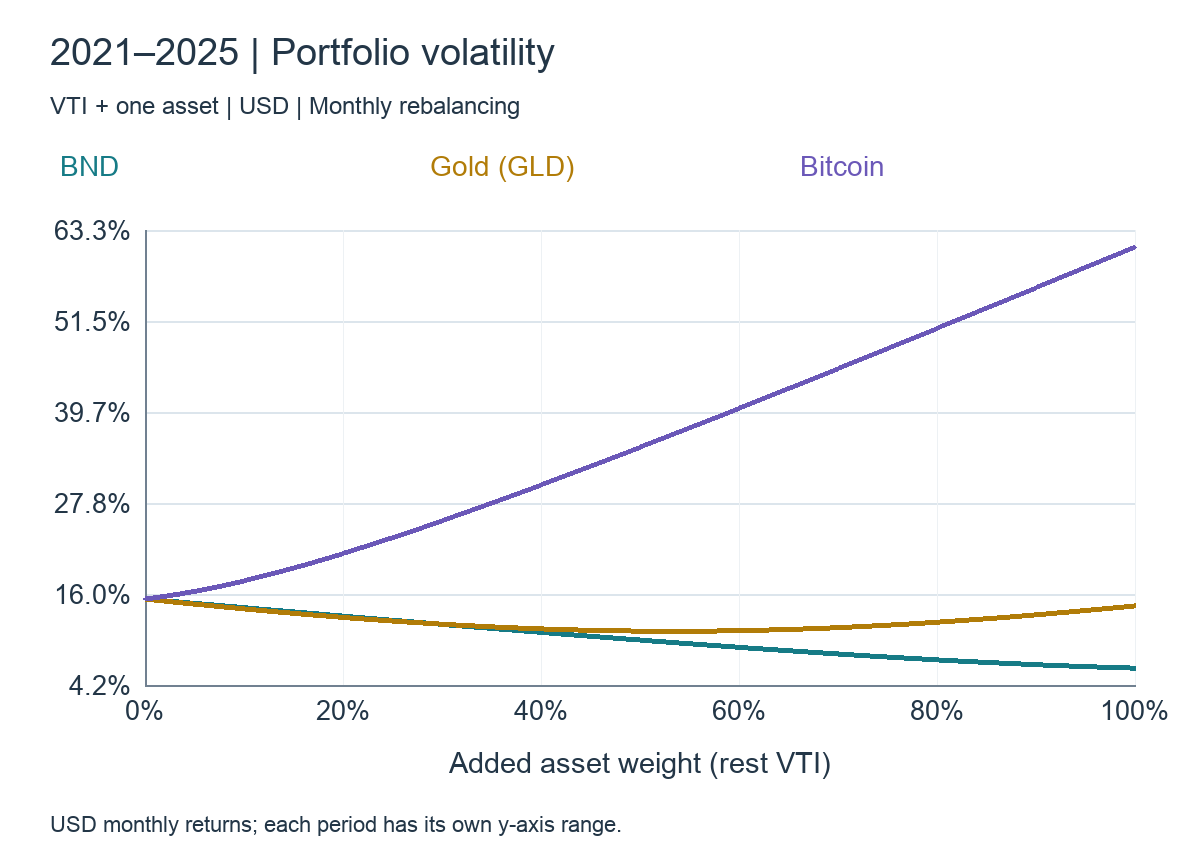
Replacing 20% of VTI with BND reduced volatility from 15.39% to 12.73%; GLD reduced it to 12.78%. Similar volatility reductions produced very different returns: 10.81% CAGR with BND versus 13.11% with GLD. Sharpe ratios were 0.72 and 0.88 respectively. Gold added a different return pattern without giving up much equity-like growth in this sample.
At 20% Bitcoin, CAGR rose to 26.47%, but volatility reached 22.50% and the month-end maximum drawdown deepened to −34.18%, versus −24.82% for VTI alone. A Sharpe ratio of 1.08 is not the same as shallow losses. Bitcoin’s result came from large growth returns compensating for large fluctuations—not from reliably cushioning falling stocks.
Even a small Bitcoin weight is not automatically defensive
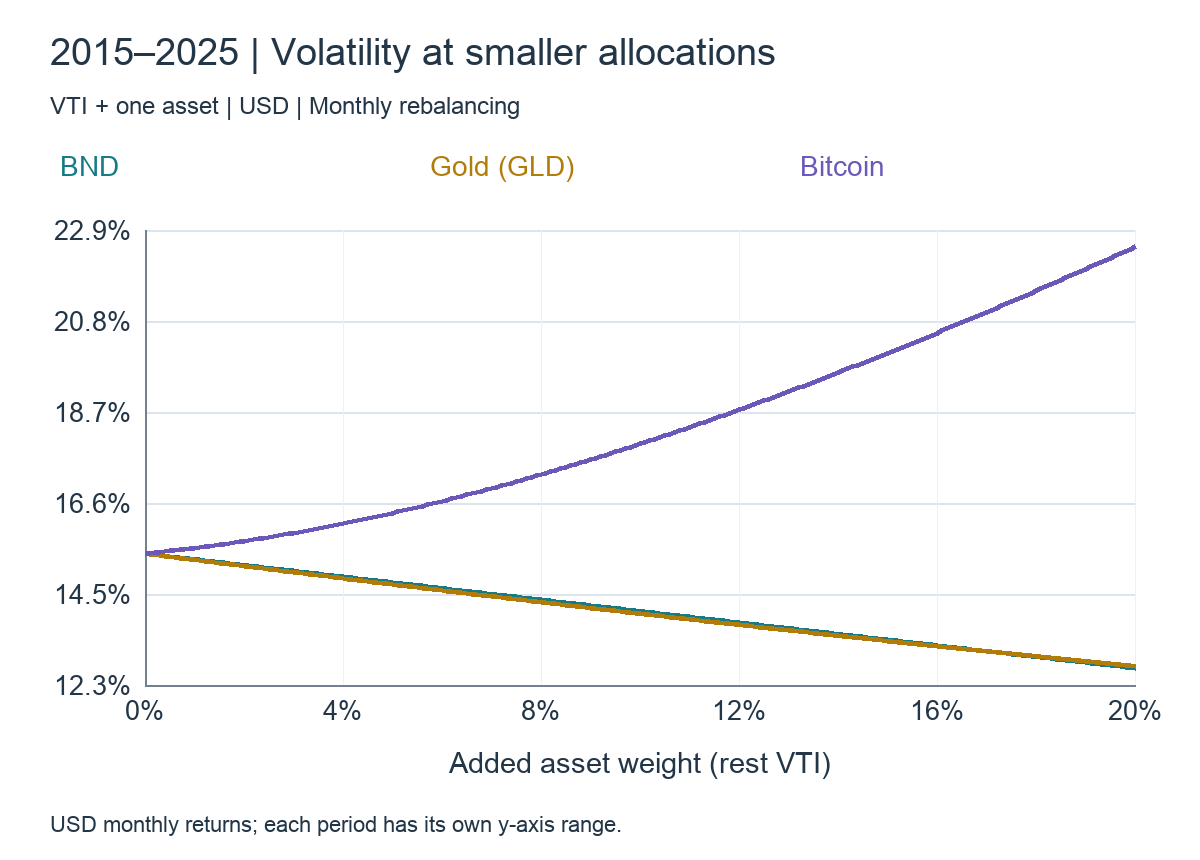
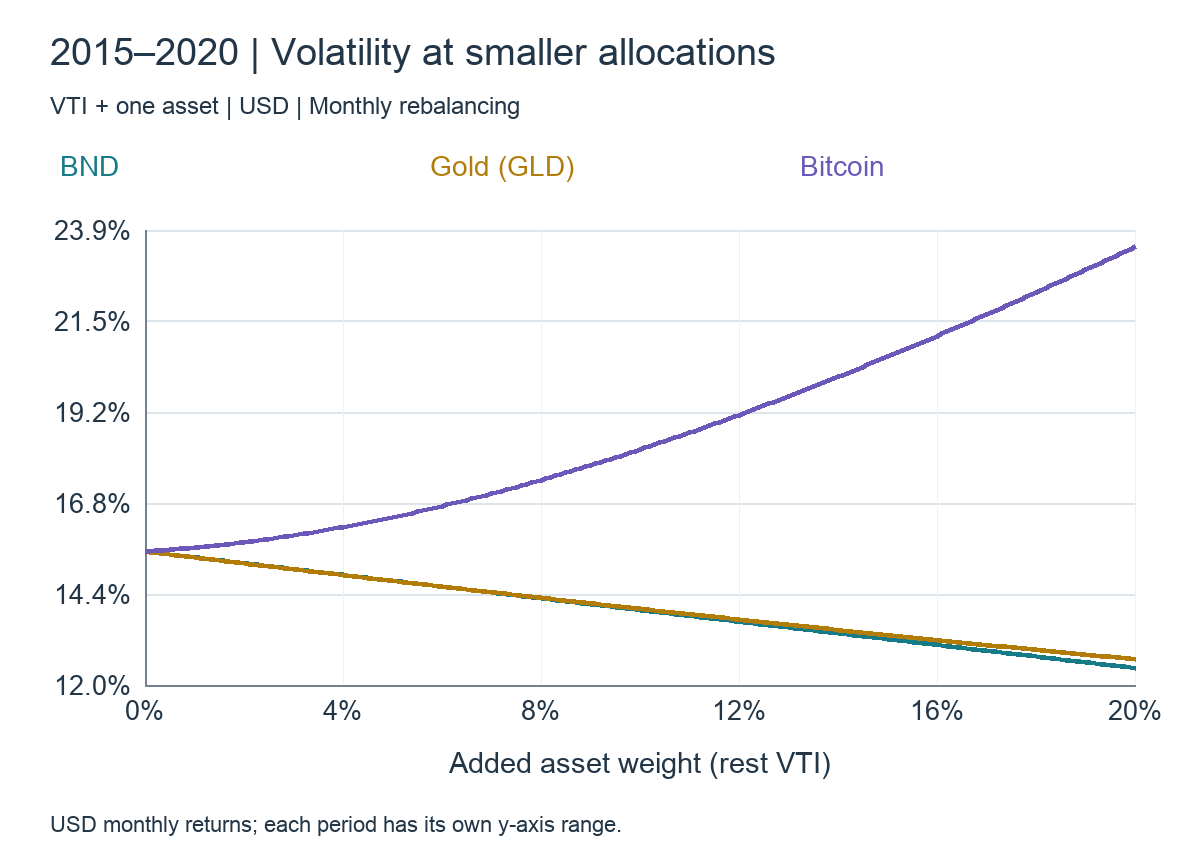
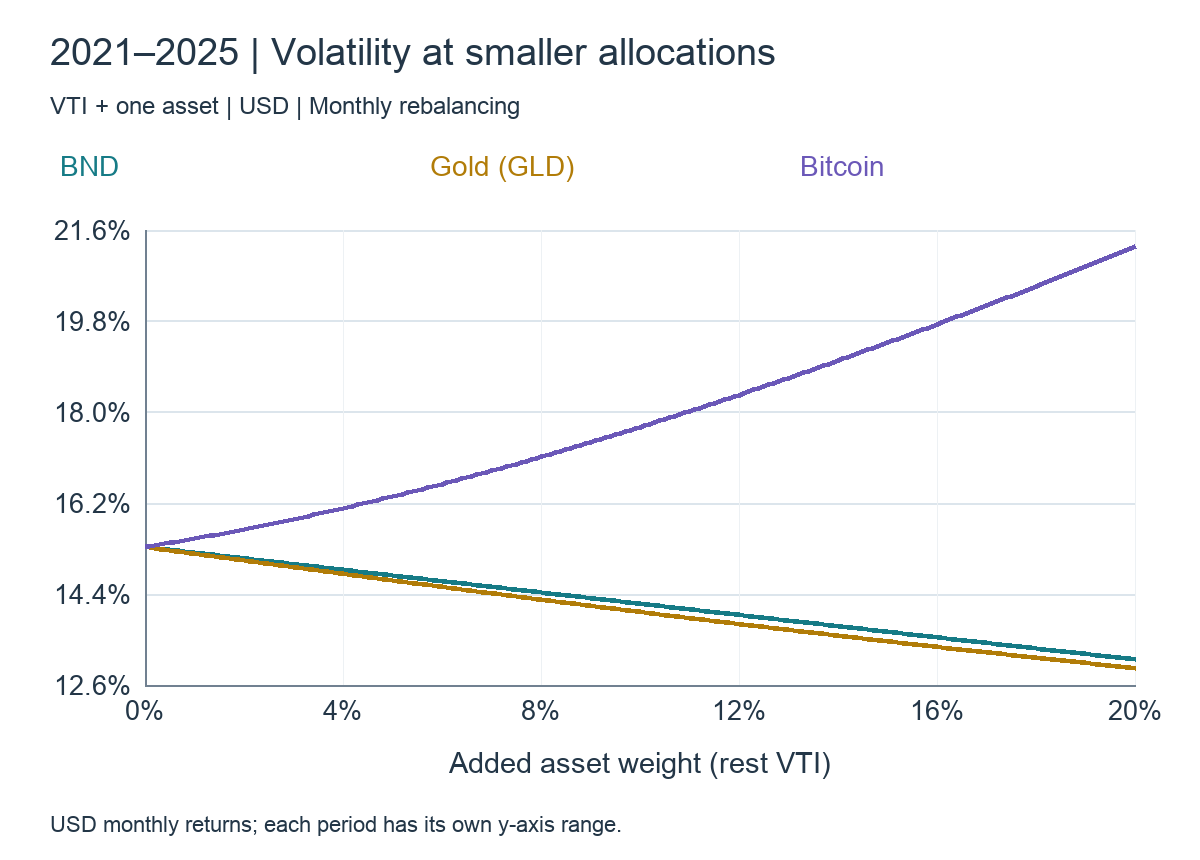
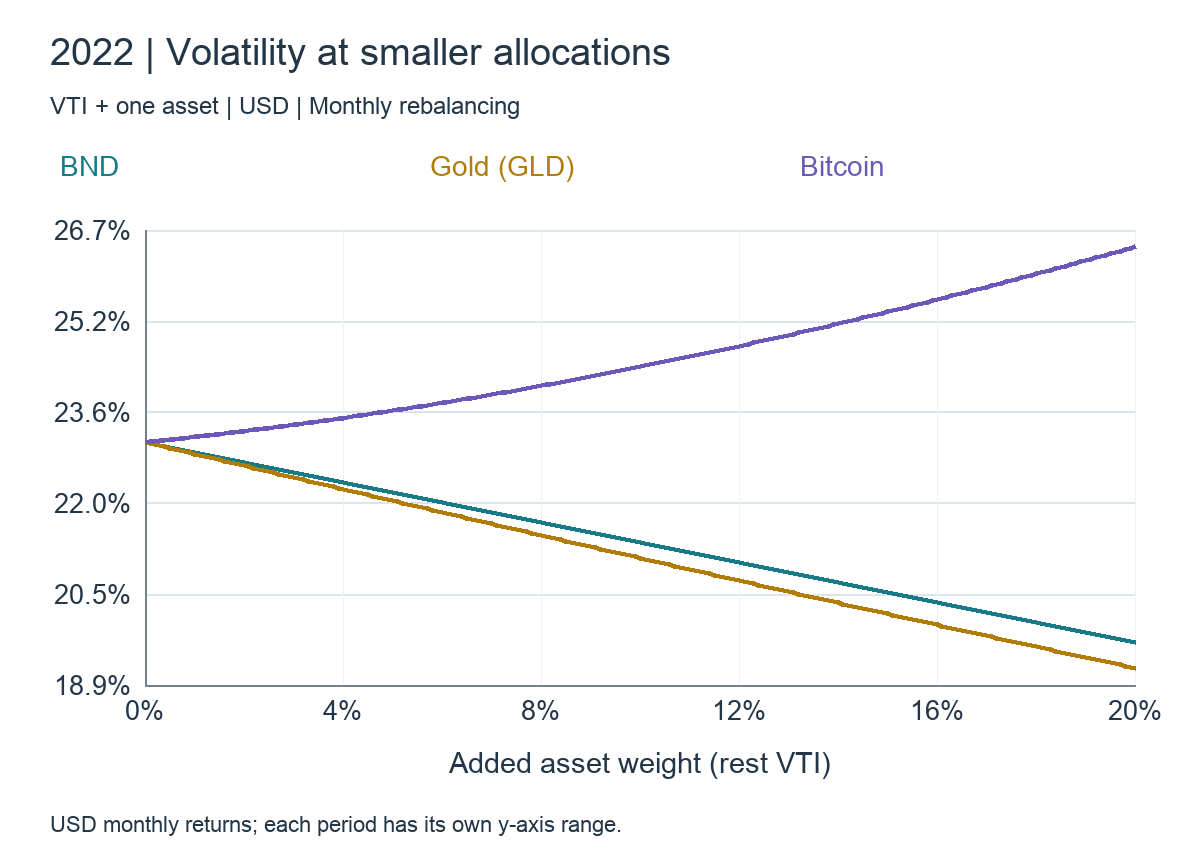
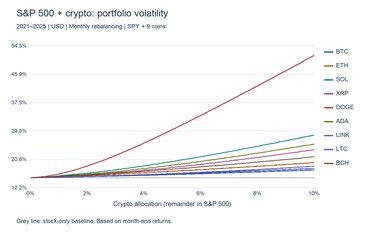
A 2% Bitcoin weight raised full-sample volatility from 15.39% to 15.68%, while increasing CAGR from 12.91% to 14.30% and Sharpe from 0.74 to 0.81. The minimum-volatility Bitcoin weight was 0%. In 2021–2025, 2% Bitcoin also raised volatility, from 15.36% to 15.70%, and CAGR from 13.07% to 13.61%.
A small dollar allocation is not necessarily a small risk allocation. Vanguard’s May 20, 2026 discussion emphasizes evaluating alternative assets through the risk being accepted rather than allocation percentages alone. Holding 20% Bitcoin does not mean accepting the same risk as holding 20% BND.
The Sharpe peak moves across eras
| Period | Partner | Partner weight | Peak Sharpe | Volatility |
|---|---|---|---|---|
| 2015–2025 | BND | 0.0% | 0.74 | 15.39% |
| 2015–2025 | GLD | 51.3% | 1.02 | 10.79% |
| 2015–2025 | BTC | 28.6% | 1.09 | 27.30% |
| 2021–2025 | BND | 0.0% | 0.68 | 15.36% |
| 2021–2025 | GLD | 62.8% | 1.13 | 11.32% |
| 2021–2025 | BTC | 15.3% | 0.74 | 19.49% |
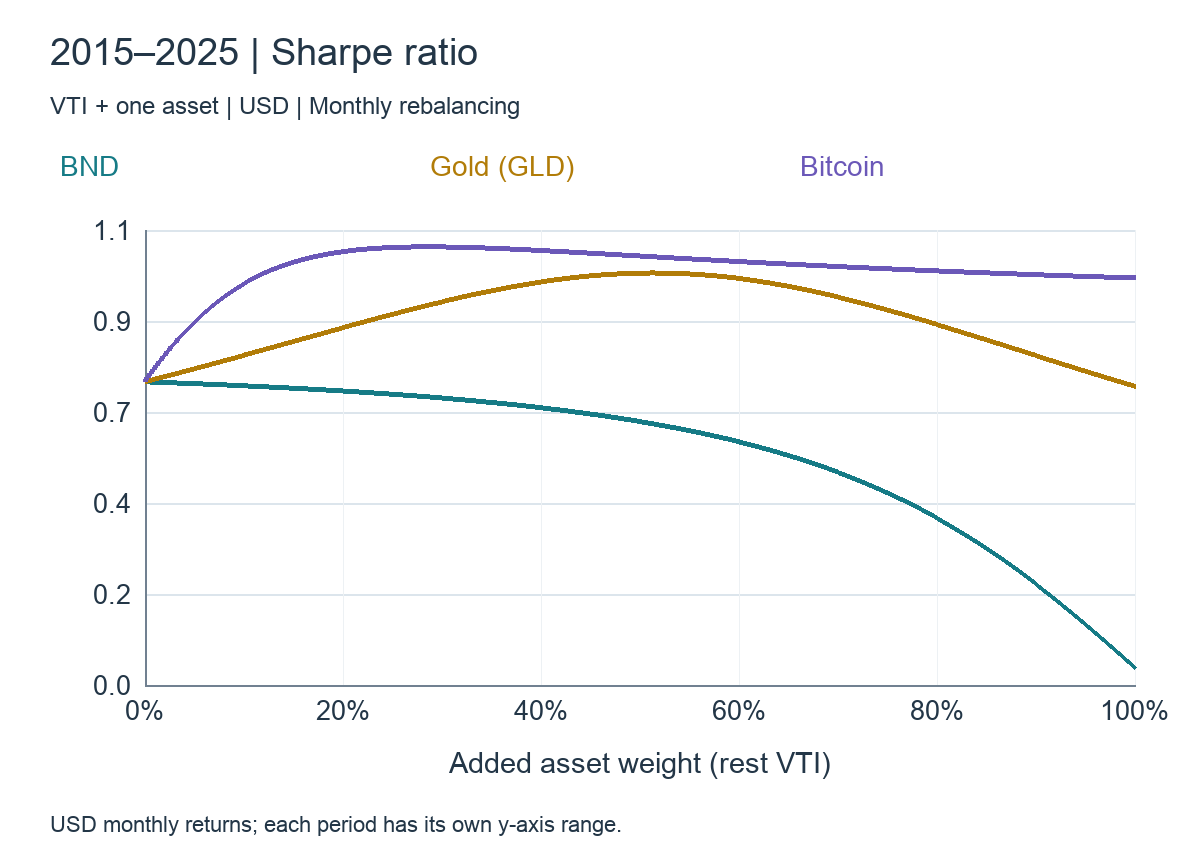
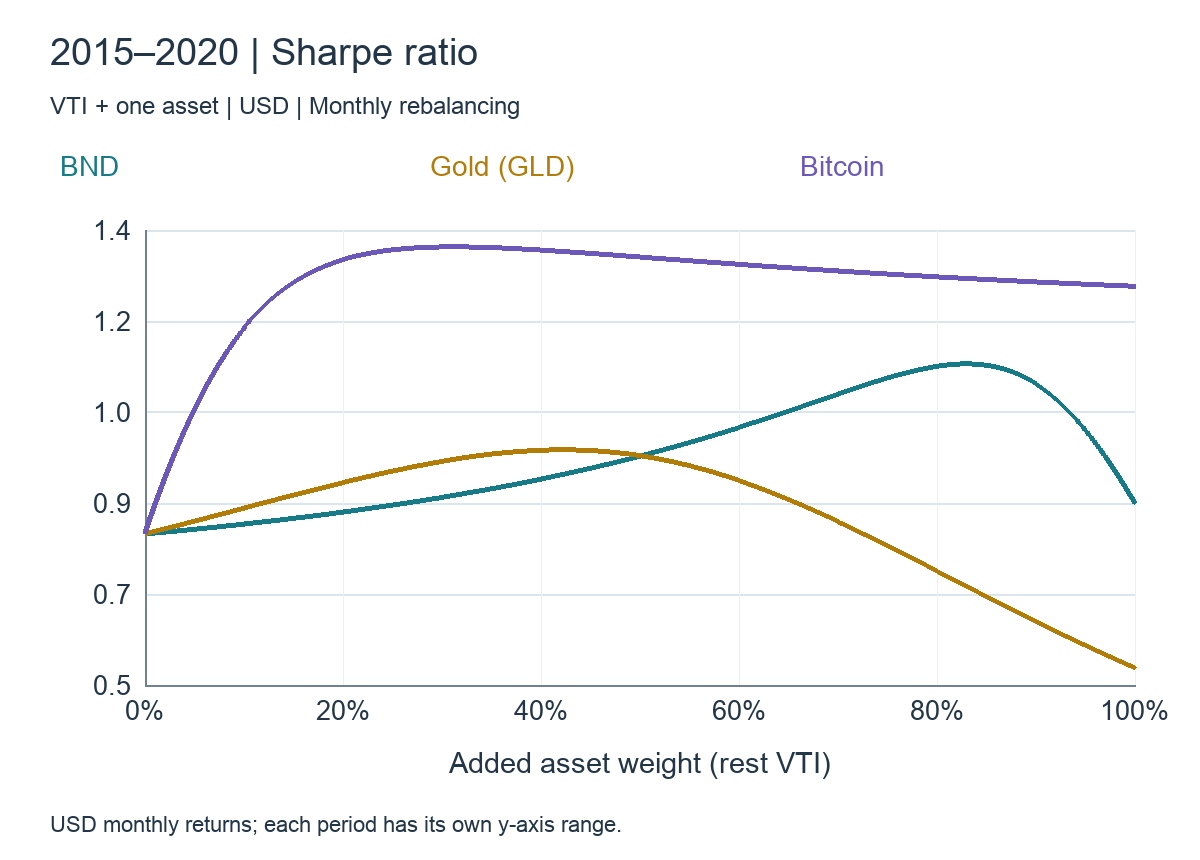
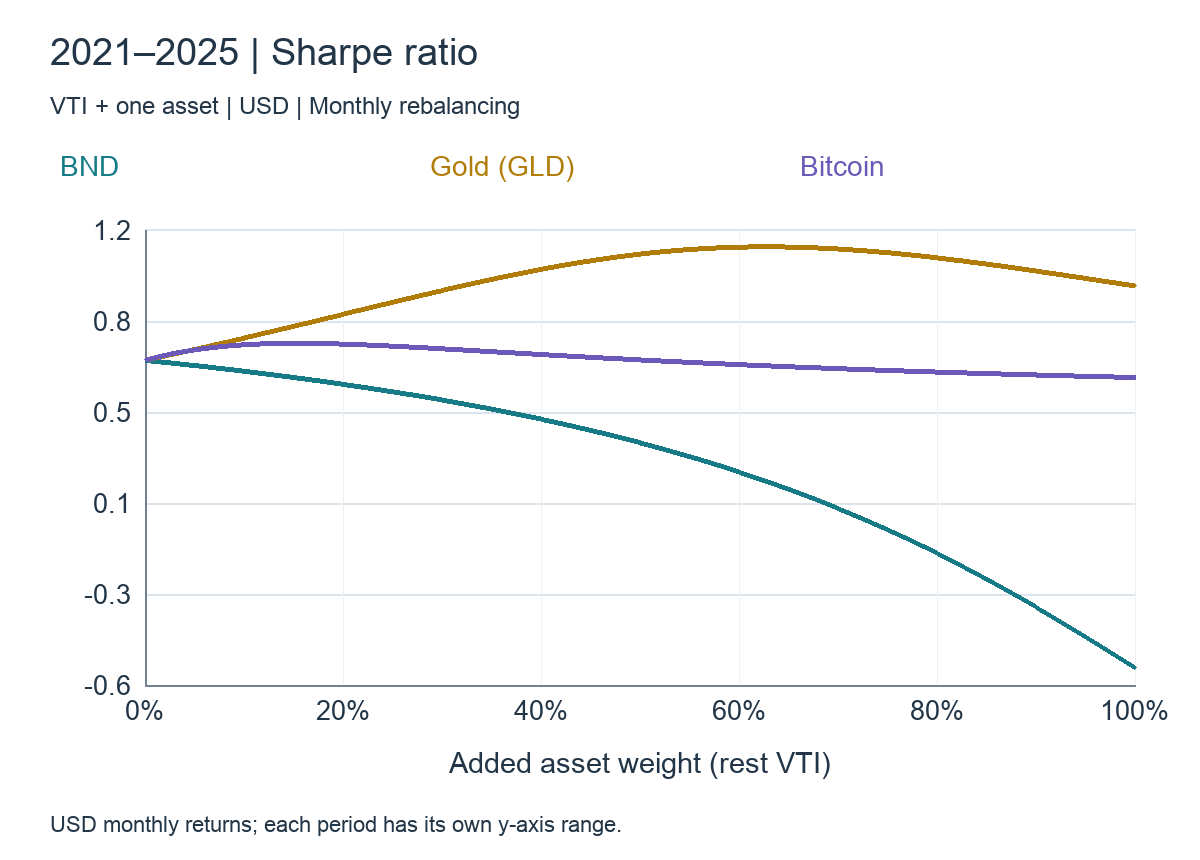
Over the full sample, GLD’s peak Sharpe was 1.02 at a 51.3% weight; Bitcoin’s was 1.09 at 28.6%. The Bitcoin portfolio had 27.30% volatility, compared with 10.79% for the gold portfolio. In 2021–2025, gold’s peak was 1.13 while Bitcoin’s was 0.74, and Bitcoin’s maximizing weight moved to 15.3%. The full-period Bitcoin result is strongly influenced by its early large gains.
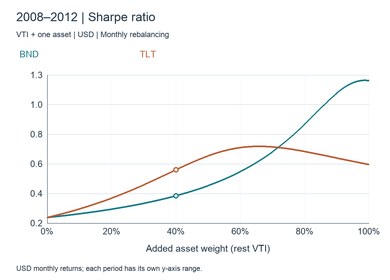
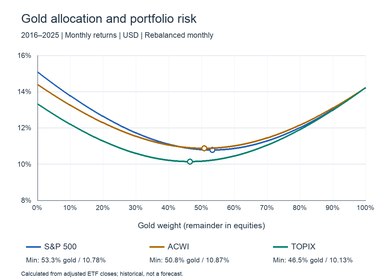
Gold’s full-sample minimum-volatility weight was 53.4%, producing 10.78% volatility. BND’s minimum occurred at 100% bonds. That endpoint removes equities altogether; it is not an answer to the best companion weight for stocks. These are descriptive peaks selected within each historical sample, not forward allocation targets. Choose a portfolio around the growth and drawdown you can live with, rather than copying the tallest historical point.
Use 2022 as a diversification stress test
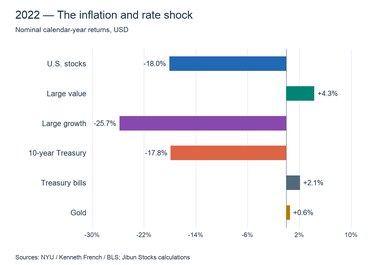
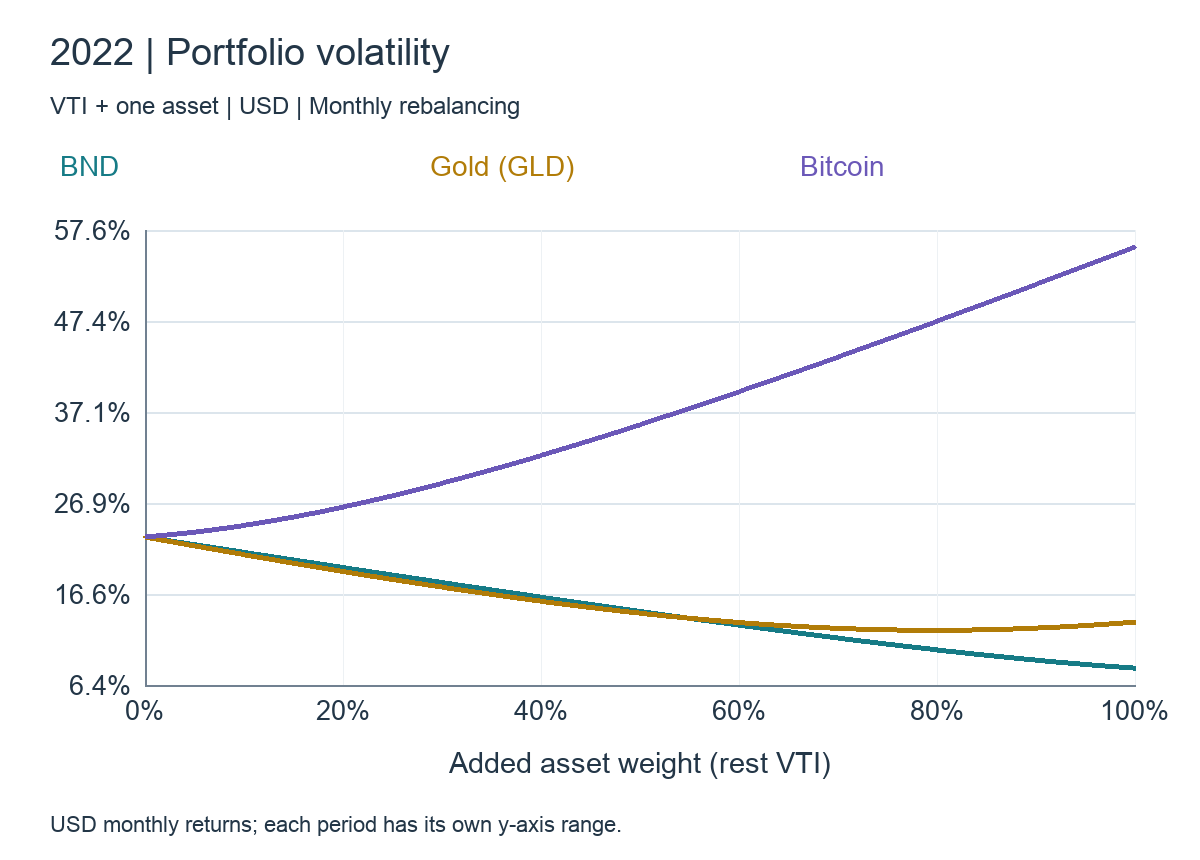
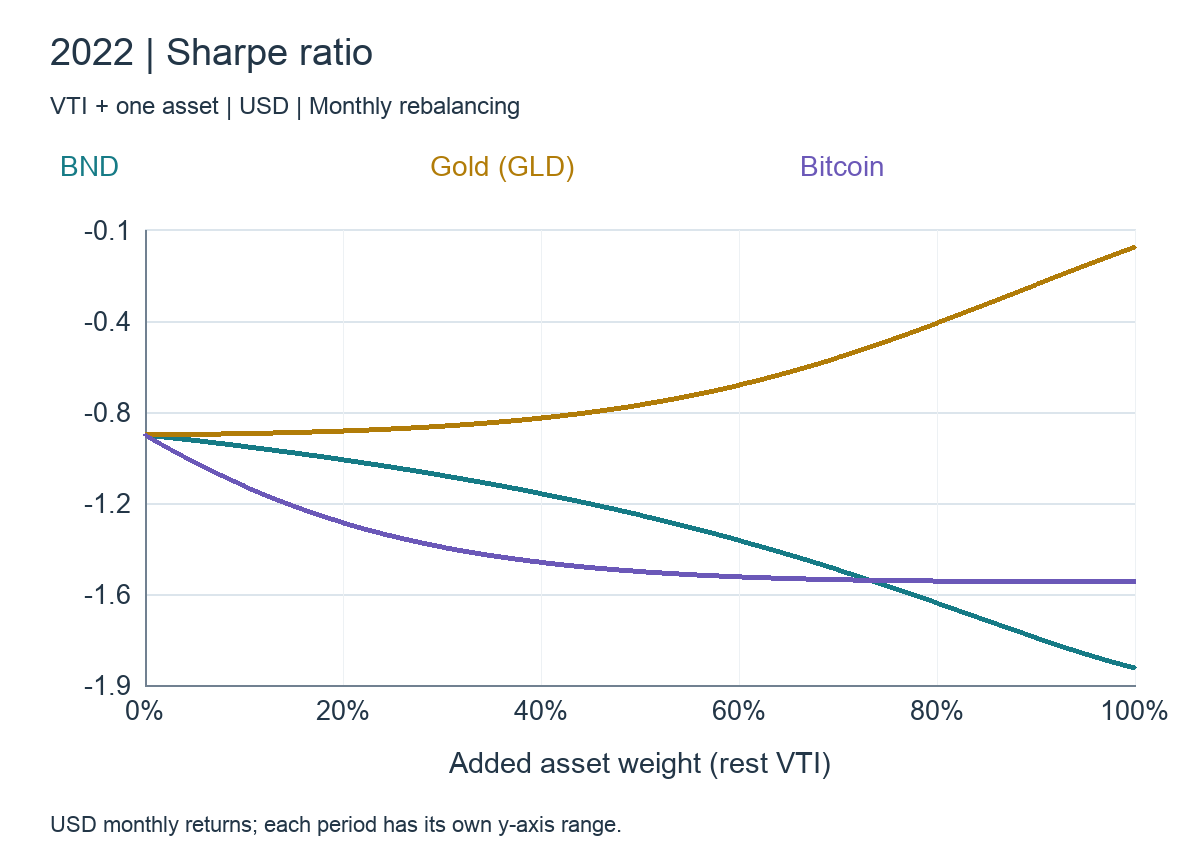
Calendar 2022 returns were −19.52% for VTI, −13.11% for BND, −0.77% for GLD and −64.15% for Bitcoin. With 20% partner weights, portfolio returns were −18.07%, −15.70% and −29.90% respectively. Gold’s small decline softened the equity loss, bonds offered limited protection, and Bitcoin deepened the decline.
Correlations with stocks rose to +0.68 for BND and +0.57 for Bitcoin. Different assets can respond to the same financial pressure. Evaluate losses and recoveries in stressful conditions, not only average correlation. All portfolio Sharpe ratios were negative in 2022; the depth of the losses conveys the roles more clearly than a ranking of those negative ratios.
Compare VTI, BND and gold on this board
Start with three neighboring charts: VTI, BND and gold. Falling stocks and rising BND show an offset in action. If both decline while gold holds up, you can examine their different reactions to rates, currencies and uncertainty. Add Bitcoin to see whether it withstands the equity decline independently or moves in the same direction with greater amplitude.
Add the U.S. 10-year yield to track the bond response to rates, and USD/JPY to separate the shared currency effect for yen-based holdings. Watch rebound speed and the order in which assets regain highs, not just whether they move oppositely on one bad day. A dedicated comparison tab with consistent chart ordering and colors makes daily observation easier.
VTI and BND use regular-market reference prices, whereas gold and Bitcoin use 24-hour references. Displayed percentage changes therefore need not share the same starting point. Compare movements over the same clock-time window and check quote timestamps; daily shapes are not a statistical correlation estimate. This study uses GLD as its long-run gold proxy, whereas the board’s gold price indicator is a different instrument. Use the board for current behavior and adjusted long-run returns for allocation analysis.
Data and calculation
We calculate 132 monthly returns from January 2015 through December 2025 using Yahoo Finance distribution- and split-adjusted VTI, BND and GLD prices and BTC/USD prices. Bitcoin observations use the same calendar dates as the last shared ETF trading day of each month, with December 2014 as the starting level. No months are missing or interpolated. ETFs use U.S. closing prices and Bitcoin uses UTC daily bars, so observation dates align but exact cutoff times differ.
Each hypothetical USD portfolio is unlevered and rebalanced monthly across partner weights of 0–100% in 0.1-percentage-point steps. Taxes, additional trading costs and Bitcoin custody costs are excluded; ETF expenses are embedded in prices. No Bitcoin lending income is added. Correlations are monthly Pearson coefficients; volatility is sample standard deviation × √12; returns are compound CAGR. Sharpe subtracts the prior month’s FRED TB3MS ÷ 1200 as an approximate cash return, then uses mean excess return ÷ excess-return standard deviation × √12. Drawdowns include starting wealth of 1 and preceding month-end peaks, not intraday lows. The 2022 stress case overlaps 2021–2025. Data and calculations were completed on October 5, 2026.
Data and references
- Yahoo Finance — VTI historical prices
- Yahoo Finance — BND historical prices
- Yahoo Finance — GLD historical prices
- Yahoo Finance — BTC/USD historical prices
- Federal Reserve / FRED — three-month Treasury bill rate
- Vanguard — BND
- SPDR — Gold Shares
- BlackRock — Sizing Bitcoin in portfolios (December 2024)
- Vanguard — Alternatives: role, risk and realism (May 2026)