A global equity fund buys companies around the world. It does not buy the world’s entire investment market. Bonds, private businesses and real estate raise a different question: what would a genuinely market-weighted portfolio look like, and how much of it can ordinary investors buy?
My conclusion is to use the market portfolio as a reference, not as a reason to collect ever more funds. Broad global equities and bonds capture the largest accessible building blocks. For the long-term growth sleeve, I favor a simple global equity fund. For the whole household balance sheet, the allocation must also accommodate spending needs and tolerable drawdowns. Those are different decisions.
From Markowitz’s diversification to Sharpe’s equilibrium
The Nobel Prize’s official account dates Harry Markowitz’s portfolio-selection contribution to 1952 and William Sharpe’s CAPM paper to 1964. Markowitz formalized portfolio choice using expected returns, variances and covariances. Sharpe developed an equilibrium framework in which, under its assumptions, investors combine a shared market portfolio of risky assets with a risk-free asset.
Markowitz did not prescribe one universal capitalization-weighted allocation for everyone. Distinguishing mean–variance optimization from CAPM equilibrium matters. A market portfolio holds risky assets in proportion to their market values; equal weights across three or eight asset classes implement a different rule.
Defining the market is harder than buying an index
Private firms, land, investment property and future labor income make a comprehensive theoretical portfolio difficult to own. Nor does adding fund names automatically broaden exposure: a separate REIT fund overlaps with real estate already included in global equities.
Doeswijk, Lam and Swinkels estimated an invested global market across equities, private equity, real estate and several bond categories. The original 2014 paper’s end-2012 estimates are below. This is neither all global wealth including owner-occupied housing nor a current 2026 allocation.
| Asset class | USD billions | Share |
|---|---|---|
| Listed equities (excluding REITs) | 32,920 | 36.35% |
| Private equity | 3,270 | 3.61% |
| Invested real estate | 4,612 | 5.09% |
| High-yield bonds | 1,523 | 1.68% |
| Emerging-market debt | 2,681 | 2.96% |
| Investment-grade credits | 16,761 | 18.51% |
| Government bonds | 26,739 | 29.52% |
| Inflation-linked bonds | 2,062 | 2.28% |
Bonds are a large part of that invested market. Holding global equities alone therefore means broad corporate ownership, not a neutral allocation across all investment assets. Capitalization-weighting bonds also gives large issuers substantial weight; it is not a ranking by creditworthiness.
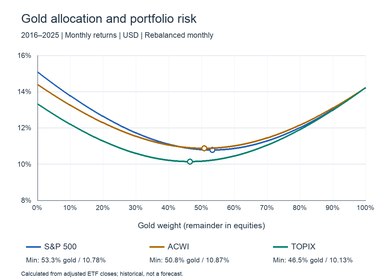
The universe changes when gold, commodities or cryptocurrency are included. Physical gold’s market value and a futures contract’s notional amount are different quantities. Adding a 10% gold sleeve can be an intentional allocation policy, but it should not be described as market capitalization without measuring that market.
A practical two-fund liquid core
We restore the $854 billion of listed REITs excluded from the paper’s equity category, because broad equity ETFs include them. Listed equity of $33,774 billion and bonds of $49,766 billion then imply 40.43% equities and 59.57% bonds within this reduced universe. Private equity and private investment property are left out. We use this historical initial allocation for VT and BNDW.
This is an accessible approximation, not complete replication. BNDW mainly covers investment-grade bonds, rather than fully reproducing the research’s high-yield, emerging-debt and inflation-linked sleeves. It also hedges non-dollar bonds to the U.S. dollar. The historical weight is a test input, not an annually updated measure of today’s market.
| Sleeve | U.S. implementation | Initial weight |
|---|---|---|
| Global equities | VT | 40.4% |
| Global IG bonds | BNDW | 59.6% |
For U.S. investors, VT covers global all-cap equities. BNDW combines broad U.S. and non-U.S. investment-grade bonds, with non-dollar currency exposure hedged to USD. ACWI supplies our all-country equity comparison. It represents large and mid-cap stocks, while VT includes small caps, so they are not identical.
Japanese investors can implement a comparable core using Rakuten’s total-world equity fund or eMAXIS Slim All Country, and SBI’s global bond index fund. Our yen-converted test models the underlying exposure, not the realized NAV history of those Japanese funds or their additional wrapper costs. Dollar-hedged global bonds are not yen-hedged bonds.
What adding the other sleeves would accomplish
REET offers global listed REIT exposure in the U.S. Japanese domestic and developed-market REIT funds provide accessible property sleeves in Japan. None buys all private property. Adding them alongside a broad equity fund increases real-estate exposure rather than cleanly filling an otherwise empty category.
High-yield, emerging-market debt and inflation-linked bond ETFs can broaden the bond sleeve. Their countries, currencies and eligibility rules must be matched to the intended universe. Listed private-equity management companies are not the same asset as direct stakes in private businesses. Daily liquidity changes what a product can own and how it is valued.
Closer replication requires ongoing capitalization estimates, overlap checks and cost management. For individuals, the relevant question is whether those tasks add enough diversification to justify the complexity. Understanding the benchmark does not require owning every approximation to it.
The 2019–2025 backtest in dollars
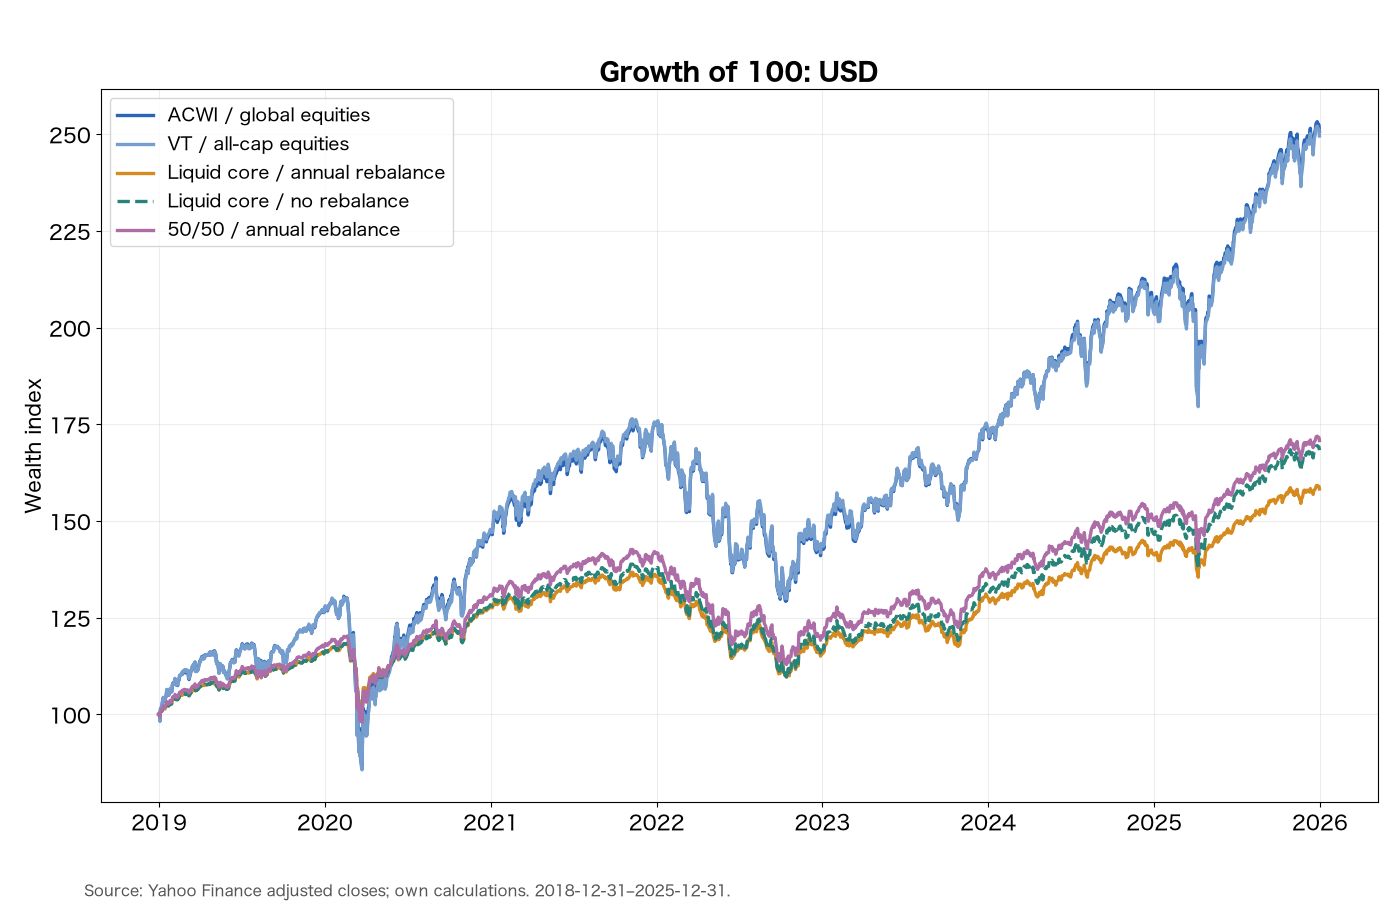
We start with 100 on December 31, 2018 and finish at the end of 2025. Adjusted ETF closes model distribution reinvestment. We compare ACWI, VT, the 40.4/59.6 liquid core rebalanced at each year-end, the same initial mix without rebalancing, and an annually rebalanced 50/50 mix. The last is an allocation sensitivity check, not a theoretically prescribed market weight.
| Portfolio | CAGR | Volatility | Max drawdown | Correlation* | Final 100 |
|---|---|---|---|---|---|
| ACWI / all-country equities | 14.03% | 15.80% | -33.53% | 1.000 | 250.7 |
| VT / all-cap equities | 13.95% | 16.08% | -34.24% | 0.999 | 249.5 |
| 40.4/59.6 / annual | 6.78% | 8.54% | -19.84% | 0.955 | 158.3 |
| 40.4/59.6 / buy and hold | 7.72% | 9.36% | -21.00% | 0.964 | 168.3 |
| 50/50 / annual | 7.95% | 9.64% | -20.86% | 0.975 | 170.8 |
ACWI compounds at 14.03% a year versus 6.78% for the annually rebalanced approximation. Ending wealth is 250.7 versus 158.3. Volatility falls from 15.80% to 8.54%. Adding bonds changes the portfolio’s output; it does not preserve the equity return while simply deleting its losses.
High correlation does not mean equivalent outcomes
The approximation’s monthly correlation with ACWI is 0.955. Its beta to ACWI is 0.516, however, and annualized tracking error is 8.05%. Similar directions coexist with substantially different amplitudes and accumulated wealth.
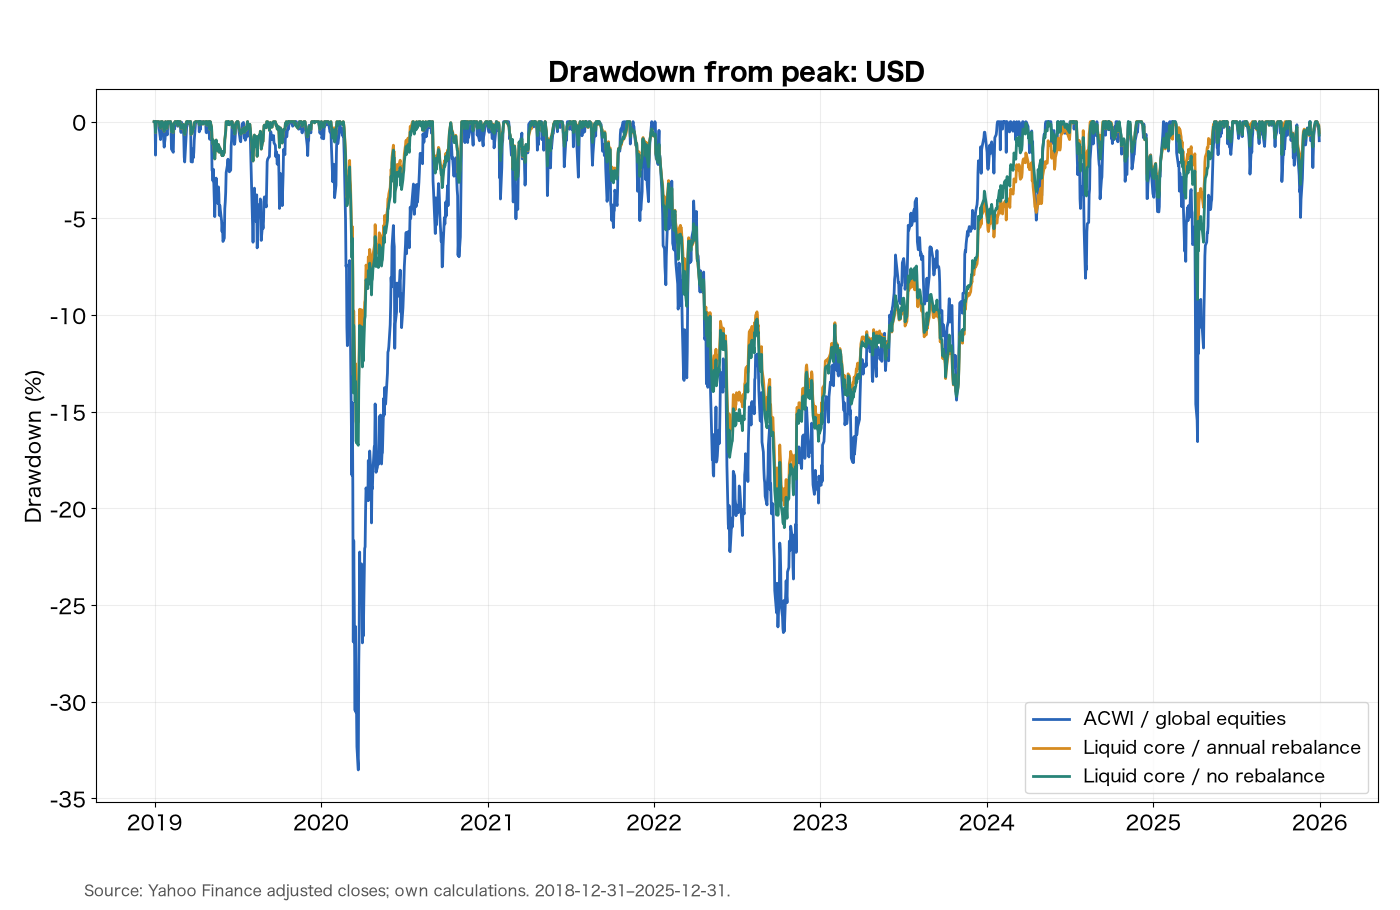
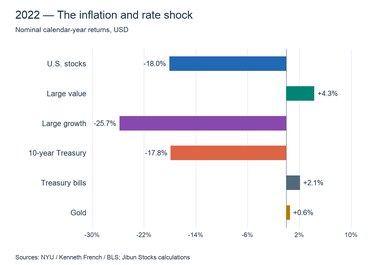
Maximum daily drawdown falls from 33.53% for ACWI to 19.84% for the approximation. Yet in 2022, ACWI returns −18.39% and the approximation also loses 14.95%. Inflation and rising discount rates can hurt both stocks and bonds. A shallower maximum drawdown does not mean protection in every negative year.
Currency changes the experience
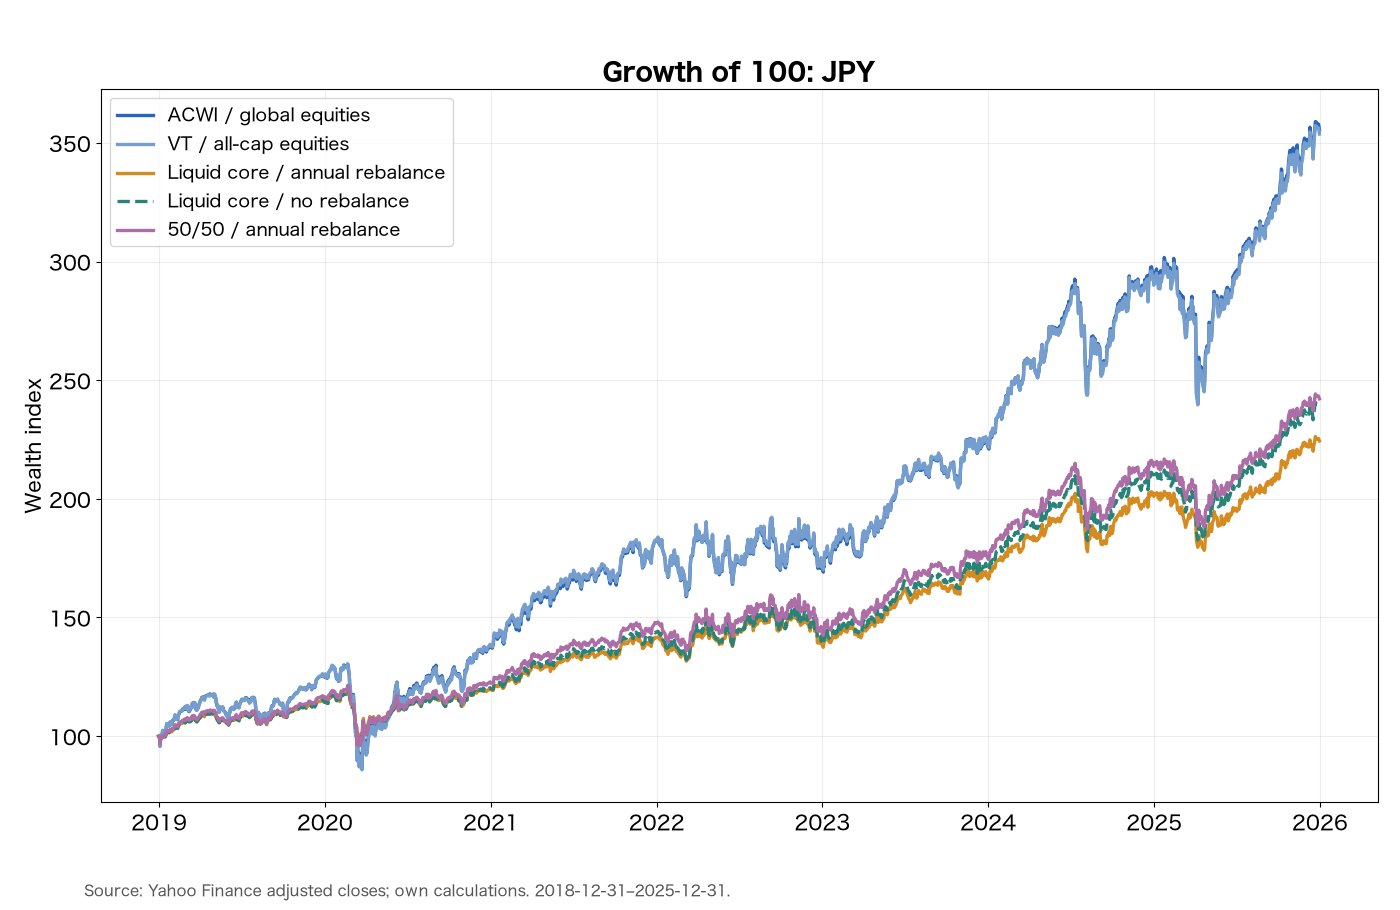
The same dollar wealth paths are converted to yen using USD/JPY. This shows the currency effect for a yen-based investor; it is not a splice of Japanese fund NAV histories. We match ETF and FX observation dates but do not reproduce Japanese valuation times or extra fund-wrapper costs.
| Portfolio | CAGR | Volatility | Max drawdown | Correlation* | Final 100 |
|---|---|---|---|---|---|
| ACWI / all-country equities | 19.86% | 15.59% | -33.37% | 1.000 | 355.5 |
| VT / all-cap equities | 19.78% | 15.82% | -34.19% | 0.999 | 353.7 |
| 40.4/59.6 / annual | 12.24% | 9.12% | -18.69% | 0.917 | 224.4 |
| 40.4/59.6 / buy and hold | 13.23% | 9.71% | -19.62% | 0.940 | 238.6 |
| 50/50 / annual | 13.47% | 10.01% | -21.01% | 0.953 | 242.1 |
Yen-converted CAGR is 19.86% for ACWI and 12.24% for the approximation. Currency movement boosts the yen results over this interval. The approximation’s volatility increases to 9.12%, versus 8.54% in dollars. A large global bond allocation is not a risk-free yen asset.
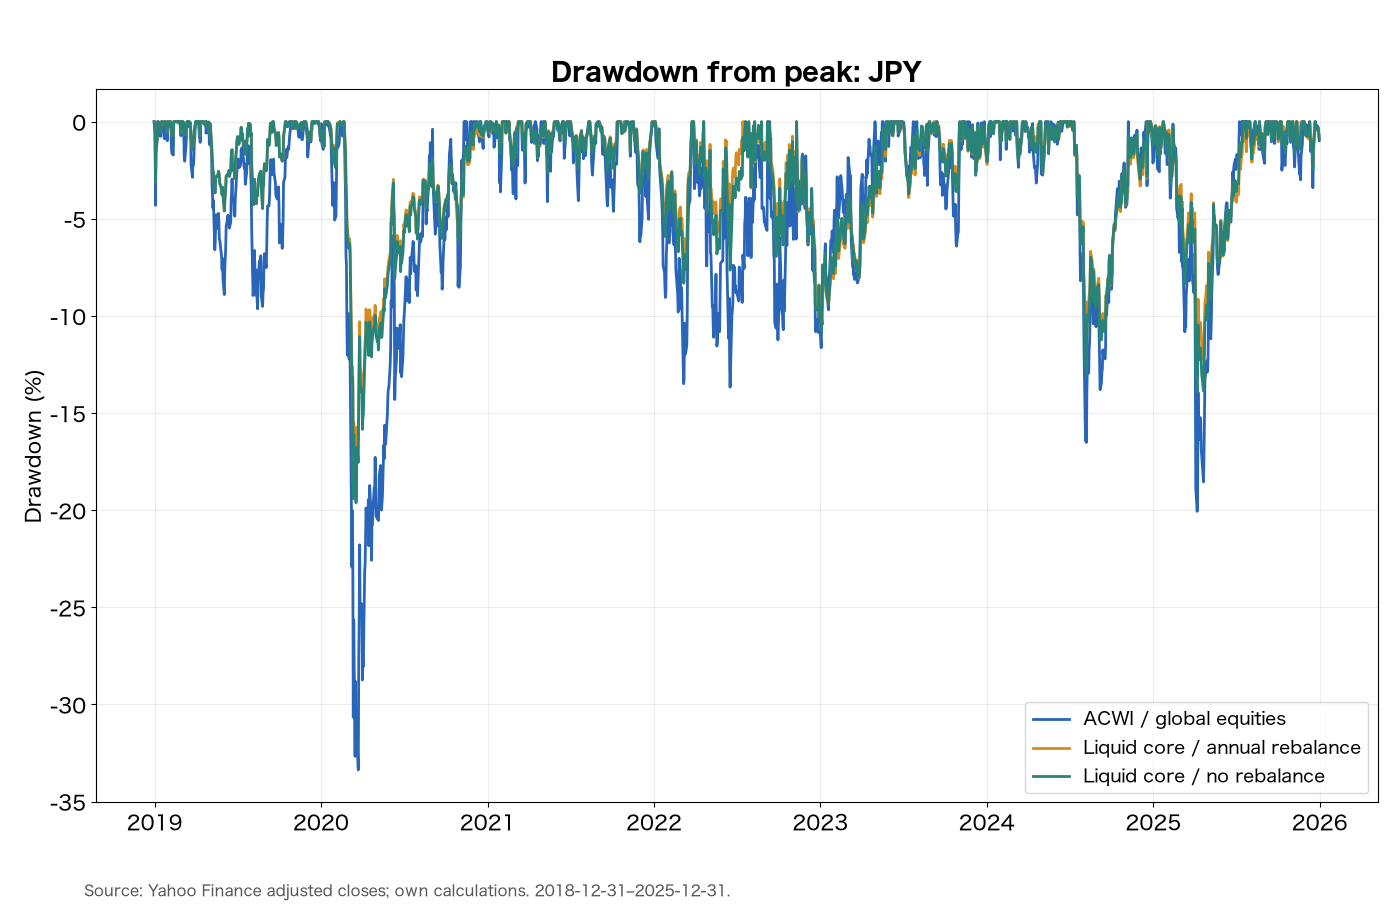
Yen-converted maximum drawdowns are 33.37% and 18.69%. Drawdown measures the fall from a previous peak, which captures a different part of the holding experience from annual returns. USD/JPY is therefore worth watching as a shared currency force acting on the portfolio.
The equity weight determines what you are buying
Each point below is an annually rebalanced mix of VT and BNDW. The horizontal axis is the equity percentage. The curves show CAGR and volatility, not a forecast of the next seven years or a prescription to choose the historical maximum.
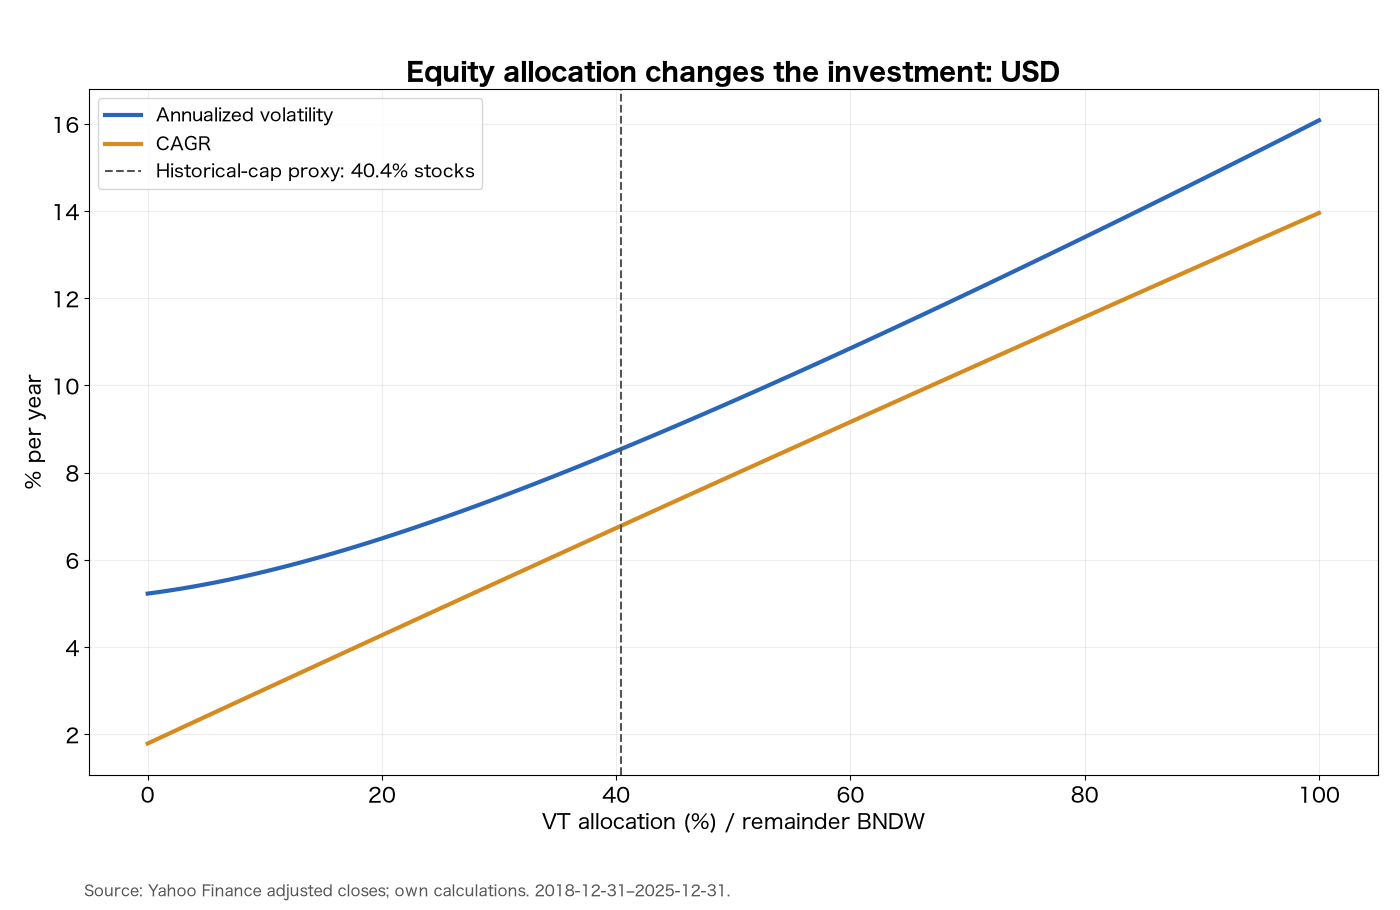
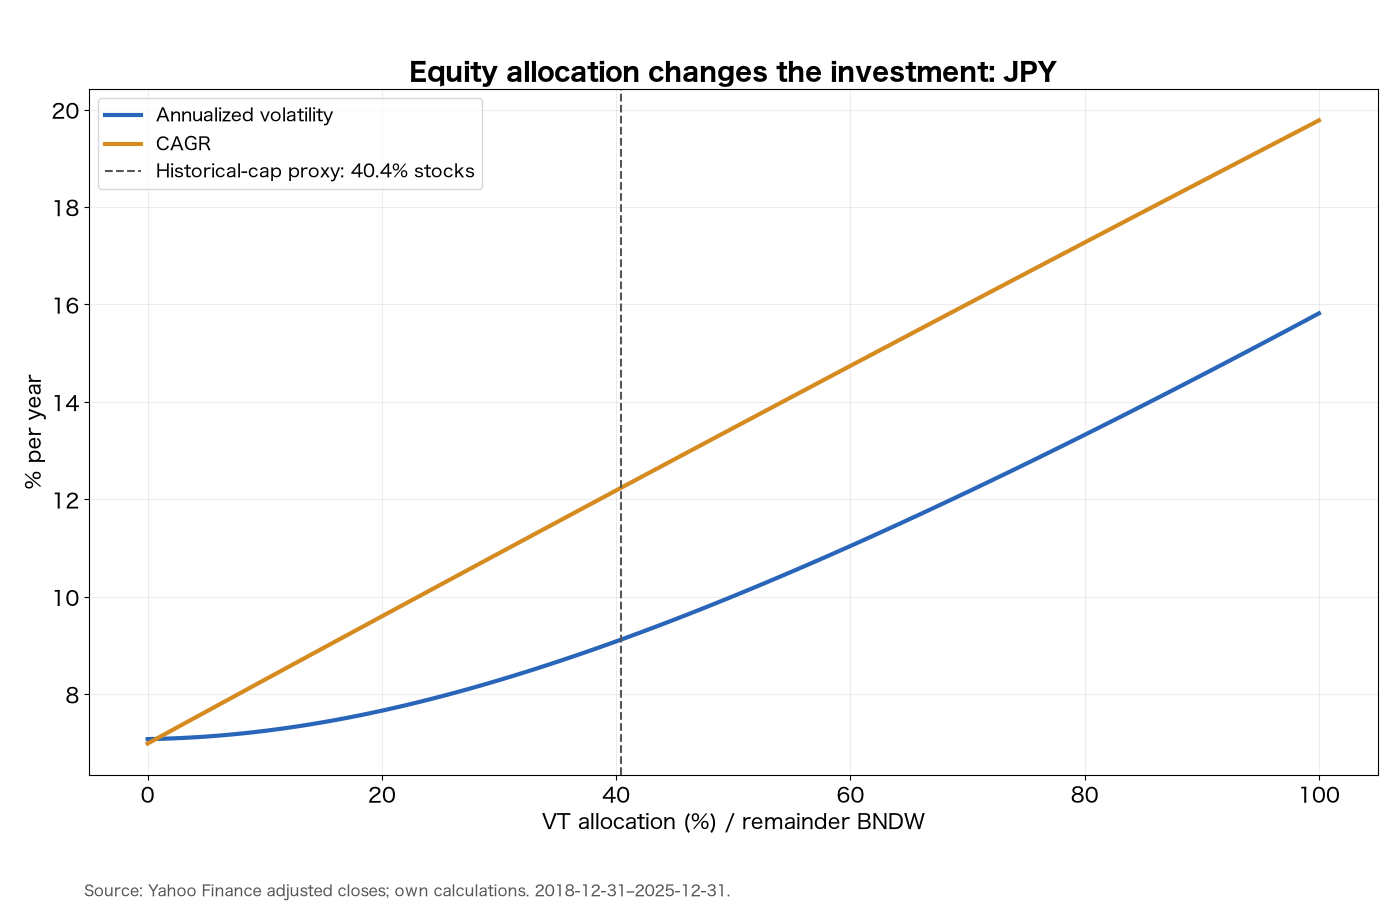
Over these seven years, increasing equities raises compound returns. Lower equity weights still serve a different purpose: reducing fluctuations. Neither “the theoretical portfolio must earn the most” nor “high correlation makes the results the same” survives the comparison. Allocation trades growth potential against the size of the journey’s swings.
Market weights and fixed-weight rebalancing are different
When an asset appreciates, its weight in the market itself rises. Pure capitalization-weighting does not require selling solely to restore an old percentage. Issuance, redemptions, listings and buybacks do require changes to reflect the available market. Index funds also adjust their internal holdings.
Returning to 40.4/59.6 each year instead maintains a fixed allocation policy. It does not remeasure global capitalization. Buying two ETFs and leaving them alone is likewise not identical to owning a constant share of every asset in the world.
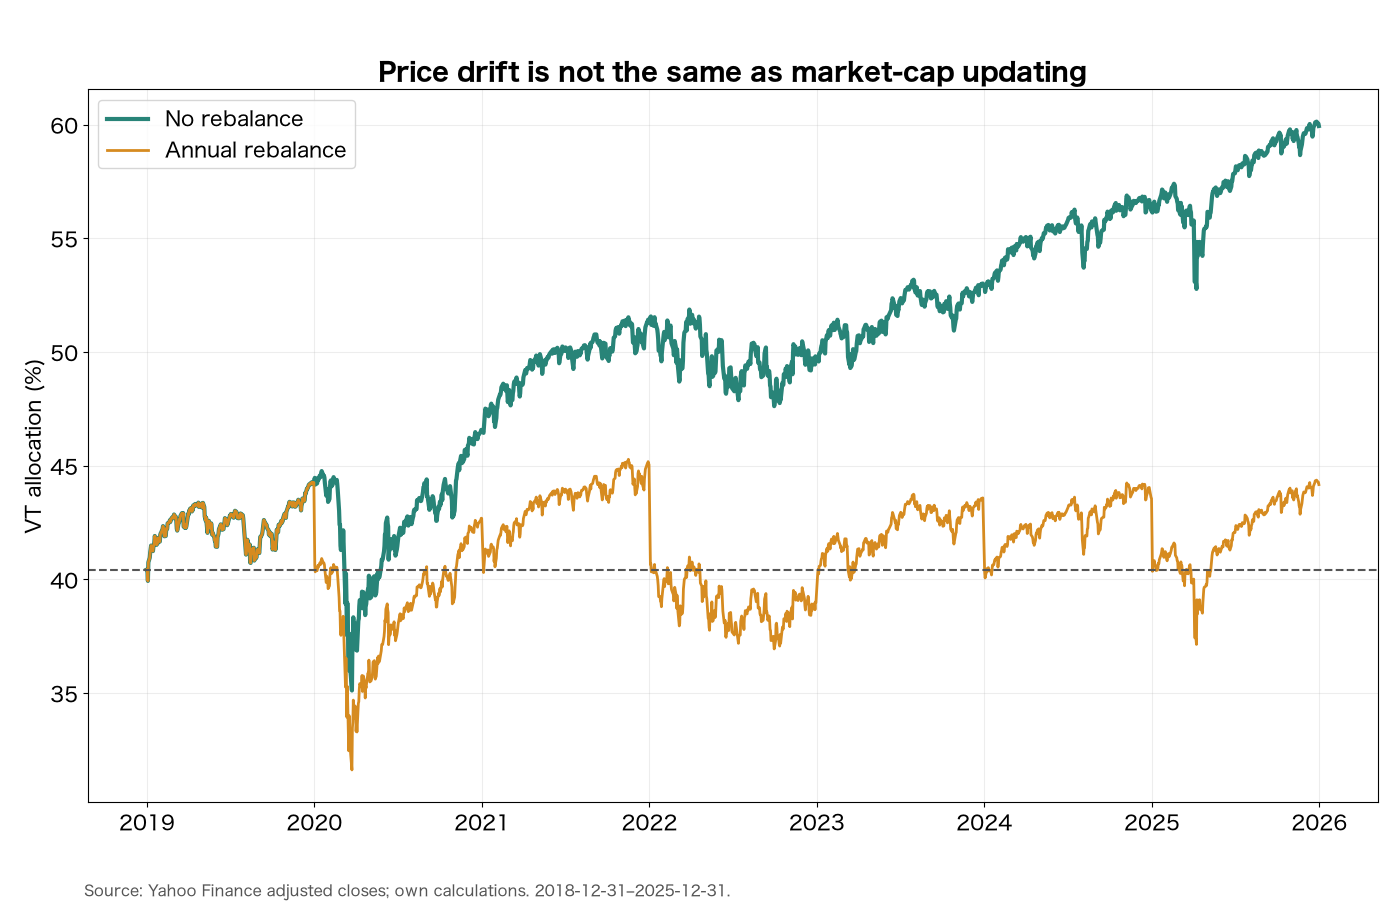
Without rebalancing, the equity weight rises from 40.4% to 59.9%. Dollar CAGR improves to 7.72%, compared with 6.78% with annual rebalancing, but volatility increases to 9.36%. Holding the winning sleeve longer explains the improvement; it does not establish that rebalancing is generally unnecessary.
A yearly review is a workable operating routine. For a fixed allocation, contributions and distributions can first be directed to the underweight sleeve, with sales reserved for larger departures. For market-weight replication, the relevant target is the newly measured market rather than the original fixed percentage. Decide what the adjustment is intended to maintain.
My choice: a simple growth core, with explicit risk management
Doeswijk and Swinkels’ study published in 2026 examines a broader market portfolio over 1970–2022. It finds a Sharpe ratio not much higher than equities, but greater stability across time and shallower, shorter drawdowns. “Not much different” here concerns risk-adjusted performance, not identical returns or losses.
Our shorter ETF approximation earns less than stocks but also falls less. For a long-horizon growth sleeve, I favor the simplicity of global equities; add broad bonds when the objective is a calmer overall portfolio. An all-country fund in Japan or VT/ACWI in the U.S. is a strong starting point. That does not require putting near-term spending money into equities.
The useful lesson of the theory is to distinguish broad ownership from bets on whichever market has recently performed best. A portfolio whose overlap, currency exposure and costs can be explained is more practical than a growing collection of imperfect replicas.
Compare the drivers on this dashboard
Place ACWI beside BND, then add the U.S. 10-year Treasury yield and USD/JPY. BND covers U.S. aggregate bonds, not the same universe as BNDW, but it helps show how interest-rate changes affect bond prices. Falling stocks and bonds alongside rising yields indicate a shared discount-rate pressure.
Falling stocks with rising bond prices and lower yields show a different relationship, where bonds can soften the equity move. USD/JPY adds the yen-based investor’s currency dimension. Use daily charts to understand relationships, and monthly or annual reviews for strategic allocation. The two tasks complement each other.
Calculation details
Yahoo Finance adjusted closes for VT, ACWI and BNDW and JPY=X closing FX observations cover common ETF trading sessions from December 31, 2018 to December 31, 2025. The model has no further contributions, allows fractional holdings and reinvests distributions. Monthly returns determine volatility, correlations, beta and tracking error; daily wealth determines drawdowns. Taxes, trading costs and extra Japanese wrapper fees are excluded. ETF operating costs already reflected in prices are not subtracted twice. BNDW launched in 2018, hence the 2019 start. The Japanese candidates are implementation examples, not retroactively backtested fund histories: SBI’s global bond mandate changed in 2024, and we do not splice the earlier strategy into the current one.
Data and references
- Nobel Prize: Markowitz and Sharpe (1990)
- Doeswijk, Lam & Swinkels (2014): The Global Multi-Asset Market Portfolio
- Original paper: Table A1, end-2012 capitalization estimates
- Doeswijk & Swinkels (2026): The Risk and Reward of Investing
- Vanguard: VT
- Vanguard: BNDW factsheet and USD hedging
- iShares: ACWI
- iShares: REET
- Rakuten: Total World Stock Index Fund
- Mitsubishi UFJ: eMAXIS Slim All Country and REIT funds
- SBI: Global Bond Index Fund
- SBI: global bond fund investment report (2025)
- SBI: prospectus and 2024 mandate change
- Yahoo Finance: VT, ACWI, BNDW and JPY=X price histories