Investment insights
Practical guides to understanding markets and comparing charts.
Building a Monthly-Income Portfolio with U.S. ETFsTest a quarterly ETF payment ladder using SPY, VXUS and Tokyo-listed 1489. Compare broad-market cores and 60/40 portfolios by volatility, Sharpe and actual monthly cash receipts.Read article →
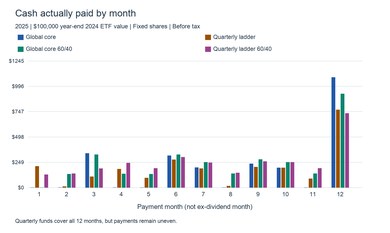 Which Crypto Pairs Best with Stocks? Comparing the Strongest CombinationsCompare the S&P 500 with nine cryptocurrencies using 2021–2025 monthly data. Allocation curves show volatility and Sharpe ratios, with a fixed-5% ranking and a recent three-year comparison.Read article →
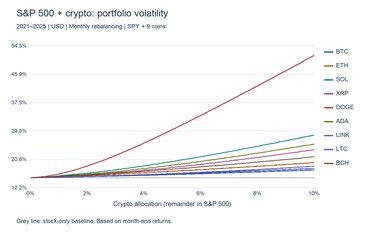 Nasdaq 100 vs. Nasdaq Composite: What Is Different?Compare their history, constituents, industries and weighting, then examine 2000–2025 returns, volatility, Sharpe ratios and drawdowns by era. Read the differences behind similar charts.Read article →
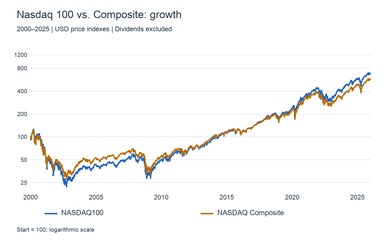 Can Buying the Dip Beat Regular Monthly Investing?Invest each paycheck immediately or wait for a decline? Six charts compare S&P 500 dip-buying rules, market eras, 23 start years, cash interest and a chronological holdout using SPY data from 1993–2025.Read article →
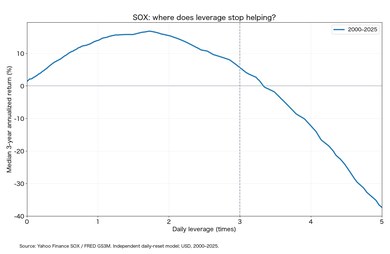
 How Much Leverage Can the SOX Semiconductor Index Handle?Test semiconductor leverage with SOX and U.S. short rates from 2000–2025. Compare median three-year returns, decade-specific leverage peaks and maximum drawdowns, while explaining SOXL’s daily 3x structure.Read article →
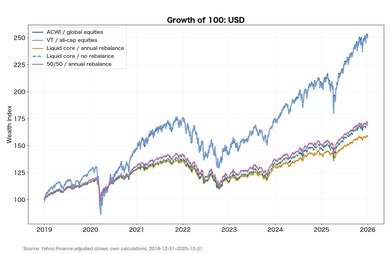
 How Can We Build the Market Portfolio Today?Translate Markowitz and Sharpe into practical funds and ETFs. Compare a global equity-and-bond approximation with all-country equities using 2019–2025 returns, correlations, drawdowns and rebalancing.Read article →
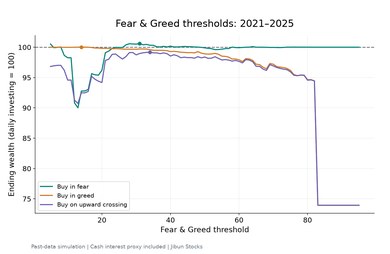
 Can the Fear & Greed Index Help You Time Investments?Compare daily S&P 500 investing with buying on fear, greed, recovery and VIX jumps. Six charts test thresholds, market eras, cash interest and a chronological holdout using 2021–2025 data.Read article →
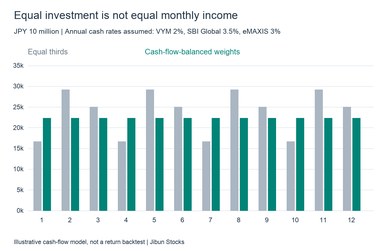
 A Low-Cost Japanese Mutual-Fund Portfolio for Monthly DistributionsCombine low-cost quarterly Japanese funds into a monthly calendar. Compare four allocations by cash-flow balance, management costs and geographical diversification.Read article →
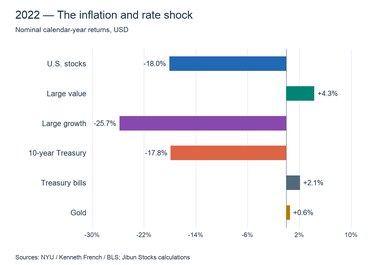
 An Era of Inflation: Which Assets Hold Up Best?Six charts compare the postwar surge, two oil shocks and recent inflation. Nominal and real returns reveal how stocks, value, growth, Treasuries and gold preserve purchasing power.Read article →
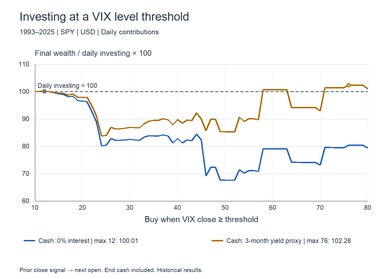
 Can the VIX Help You Time S&P 500 Investments?SPY and VIX data from 1993–2025 test daily investing against saving cash for fear signals. Six charts compare level and change thresholds, cash interest, different eras and a chronological holdout.Read article →
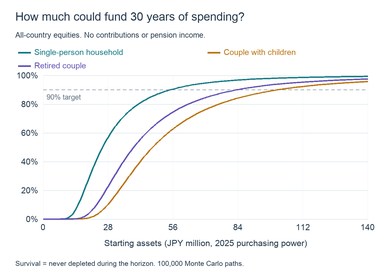
 How Much in a NISA Could Make Further Contributions Unnecessary?A 100,000-path Monte Carlo study combines global equities with Japanese household spending. Compare 20–50-year survival probabilities and 80–99% funding targets for singles, families and retired couples.Read article →
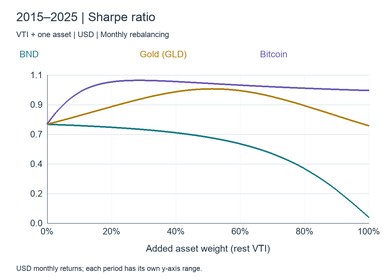
 Which Asset Pairs Best with Stocks? Bonds, Gold and Bitcoin ComparedCombine VTI with BND, gold or Bitcoin and compare correlations, volatility and Sharpe ratios from 2015–2025. Allocation curves separate stability, diversification and growth.Read article →
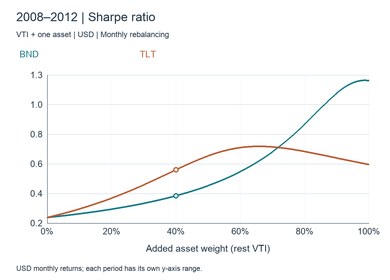
 Stocks and Bonds: Has Diversification Stopped Working?Compare VTI with BND and TLT across market eras. Allocation curves reveal how volatility, returns, Sharpe ratios and drawdowns changed—and what remains useful about 60/40.Read article →
 A New 3x Nasdaq-100 Fund: Where Is the Optimal Leverage?Measure daily compounding and financing costs, compare the full post-2000 sample with the latest decade, and examine what 3x leverage delivers.Read article →
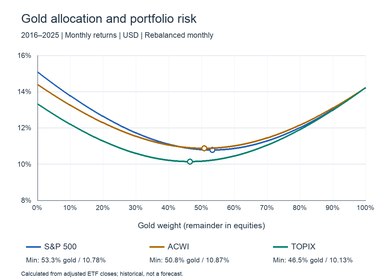
 Gold and Stocks: What Is the Best Balance?Measure ten years of correlation, volatility and Sharpe ratios, then plot how gold changes portfolios built with the S&P 500, ACWI or TOPIX.Read article →
 S&P 500 vs. Nasdaq 100: What Is the Difference?Read the differences behind similar-looking charts: constituents, volatility, interest rates and practical dashboard comparisons.Read article →
What Is 24-Hour Trading, and How Does It Work?Why prices move when stock exchanges are closed: CFDs, perpetual futures, regular indexes and practical ways to read after-hours charts.Read article →
SOX vs. SMH: What Is the Difference?Both follow semiconductors, but SMH does not track SOX. Understand their different constituents and weights, and read the gaps between similar-looking charts.Read article →
Why Are S&P 500 Funds, VTI and VEA So Popular in the U.S. Compared with All-World Funds?Understand domestic equity building blocks, international allocations and costs—and what VTI, VEA and global-stock charts reveal together.Read article →
S&P 500 vs. Nasdaq 100: What Is the Difference?Read the differences behind similar-looking charts: constituents, volatility, interest rates and practical dashboard comparisons.Read article →
What Is 24-Hour Trading, and How Does It Work?Why prices move when stock exchanges are closed: CFDs, perpetual futures, regular indexes and practical ways to read after-hours charts.Read article →
SOX vs. SMH: What Is the Difference?Both follow semiconductors, but SMH does not track SOX. Understand their different constituents and weights, and read the gaps between similar-looking charts.Read article →
Why Are S&P 500 Funds, VTI and VEA So Popular in the U.S. Compared with All-World Funds?Understand domestic equity building blocks, international allocations and costs—and what VTI, VEA and global-stock charts reveal together.Read article →
Back to home →
Which Crypto Pairs Best with Stocks? Comparing the Strongest CombinationsCompare the S&P 500 with nine cryptocurrencies using 2021–2025 monthly data. Allocation curves show volatility and Sharpe ratios, with a fixed-5% ranking and a recent three-year comparison.Read article →
Nasdaq 100 vs. Nasdaq Composite: What Is Different?Compare their history, constituents, industries and weighting, then examine 2000–2025 returns, volatility, Sharpe ratios and drawdowns by era. Read the differences behind similar charts.Read article →
Can Buying the Dip Beat Regular Monthly Investing?Invest each paycheck immediately or wait for a decline? Six charts compare S&P 500 dip-buying rules, market eras, 23 start years, cash interest and a chronological holdout using SPY data from 1993–2025.Read article →
How Much Leverage Can the SOX Semiconductor Index Handle?Test semiconductor leverage with SOX and U.S. short rates from 2000–2025. Compare median three-year returns, decade-specific leverage peaks and maximum drawdowns, while explaining SOXL’s daily 3x structure.Read article →
How Can We Build the Market Portfolio Today?Translate Markowitz and Sharpe into practical funds and ETFs. Compare a global equity-and-bond approximation with all-country equities using 2019–2025 returns, correlations, drawdowns and rebalancing.Read article →
Can the Fear & Greed Index Help You Time Investments?Compare daily S&P 500 investing with buying on fear, greed, recovery and VIX jumps. Six charts test thresholds, market eras, cash interest and a chronological holdout using 2021–2025 data.Read article →
A Low-Cost Japanese Mutual-Fund Portfolio for Monthly DistributionsCombine low-cost quarterly Japanese funds into a monthly calendar. Compare four allocations by cash-flow balance, management costs and geographical diversification.Read article →
An Era of Inflation: Which Assets Hold Up Best?Six charts compare the postwar surge, two oil shocks and recent inflation. Nominal and real returns reveal how stocks, value, growth, Treasuries and gold preserve purchasing power.Read article →
Can the VIX Help You Time S&P 500 Investments?SPY and VIX data from 1993–2025 test daily investing against saving cash for fear signals. Six charts compare level and change thresholds, cash interest, different eras and a chronological holdout.Read article →
How Much in a NISA Could Make Further Contributions Unnecessary?A 100,000-path Monte Carlo study combines global equities with Japanese household spending. Compare 20–50-year survival probabilities and 80–99% funding targets for singles, families and retired couples.Read article →
Which Asset Pairs Best with Stocks? Bonds, Gold and Bitcoin ComparedCombine VTI with BND, gold or Bitcoin and compare correlations, volatility and Sharpe ratios from 2015–2025. Allocation curves separate stability, diversification and growth.Read article →
Stocks and Bonds: Has Diversification Stopped Working?Compare VTI with BND and TLT across market eras. Allocation curves reveal how volatility, returns, Sharpe ratios and drawdowns changed—and what remains useful about 60/40.Read article →
A New 3x Nasdaq-100 Fund: Where Is the Optimal Leverage?Measure daily compounding and financing costs, compare the full post-2000 sample with the latest decade, and examine what 3x leverage delivers.Read article →
Gold and Stocks: What Is the Best Balance?Measure ten years of correlation, volatility and Sharpe ratios, then plot how gold changes portfolios built with the S&P 500, ACWI or TOPIX.Read article →
S&P 500 vs. Nasdaq 100: What Is the Difference?Read the differences behind similar-looking charts: constituents, volatility, interest rates and practical dashboard comparisons.Read article →
What Is 24-Hour Trading, and How Does It Work?Why prices move when stock exchanges are closed: CFDs, perpetual futures, regular indexes and practical ways to read after-hours charts.Read article →
SOX vs. SMH: What Is the Difference?Both follow semiconductors, but SMH does not track SOX. Understand their different constituents and weights, and read the gaps between similar-looking charts.Read article →
Why Are S&P 500 Funds, VTI and VEA So Popular in the U.S. Compared with All-World Funds?Understand domestic equity building blocks, international allocations and costs—and what VTI, VEA and global-stock charts reveal together.Read article →