Crypto is moving from a specialist exchange product into an asset that investors can place alongside equities in a brokerage account. In January 2024 the SEC approved spot Bitcoin ETP listings and trading; in May it approved exchange rule changes for spot Ether ETPs. As access develops, the useful question expands from “Will this rise?” to “What does this do to the stocks I already own?”
We compared nine coins on this site against an S&P 500 allocation. Two conclusions stand out. Every coin’s minimum-volatility allocation was zero. If we require a 5% crypto allocation, BTC added the least volatility. SOL delivered the highest historical Sharpe optimum in the full sample. The safest mix and the most efficient historical growth mix are different questions.
From Bitcoin to payments, applications and external data
Bitcoin grew from Satoshi Nakamoto’s design for peer-to-peer electronic value transfer without a trusted intermediary. Its implementation appeared in 2009. Shared transaction records and cryptographic verification opened a different path from balances controlled by a single operator. Its supply rules and network became valuation considerations, unlike an equity claim on a company’s profits.
Ethereum launched on July 30, 2015, adding a platform for smart contracts and applications. Solana began mainnet beta in 2020. The XRP Ledger dates to 2012, with payments as a central use case. Chainlink’s oracle networks connect blockchains to external data. “Crypto” therefore describes a shelf containing projects with different jobs, not one identical economic exposure.
| Coin | Project role |
|---|---|
| BTC | Digital scarcity and peer-to-peer transfers |
| ETH | Smart contracts and decentralized applications |
| SOL | High-throughput smart-contract platform |
| XRP | Transfers and payments on the XRP Ledger |
| DOGE | Community-led peer-to-peer currency |
| ADA | Proof-of-stake smart-contract platform |
| LINK | Oracle networks connecting outside data |
| LTC | Peer-to-peer payments |
| BCH | Bitcoin-derived peer-to-peer electronic cash |
DOGE’s community, ADA’s application platform and LTC and BCH’s payment orientation attract different expectations. But different technology does not guarantee different market behavior. If liquidity, interest rates and willingness to take risk drive them together, their technical differences will not automatically cushion equities. Prices let us test that distinction.
One window, one currency and one rebalancing rule
We used BTC, ETH, SOL, XRP, DOGE, ADA, LINK, LTC and BCH in U.S. dollars. Dividend-adjusted SPY prices represent an S&P 500 investment. The common window is January 2021 through December 2025: 60 monthly returns. Crypto weights run from 0% to 100% in 0.1-percentage-point steps. A 5% allocation means 95% stocks and 5% of one coin, rebalanced to those weights each month.
Volatility annualizes the variation in monthly returns. Sharpe measures returns above a short-term Treasury rate relative to variation in excess returns. Lower volatility serves stability; higher Sharpe serves historical risk-adjusted efficiency. The stock-only baseline had 15.14% volatility, a 0.758 Sharpe and 14.34% CAGR.
All nine minimum-volatility portfolios contain no crypto
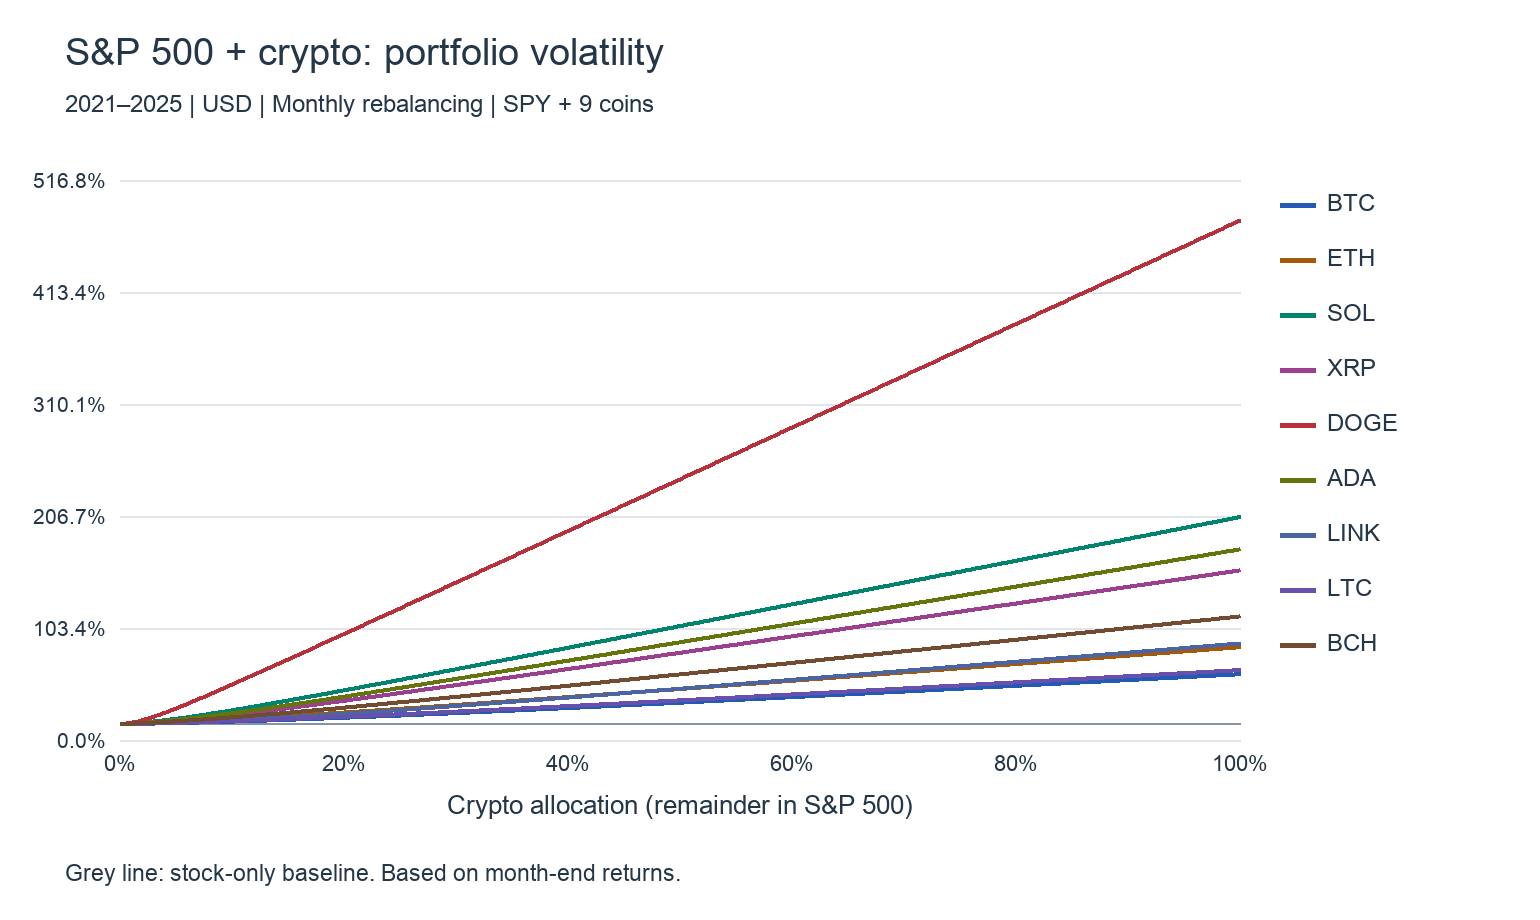
Across the complete allocation range, volatility rises as crypto weight rises. All nine minimum points are at 0%. Before comparing the coins with each other, read their position against the stock-only baseline. This sample does not support the claim that adding crypto reduces equity-portfolio volatility.
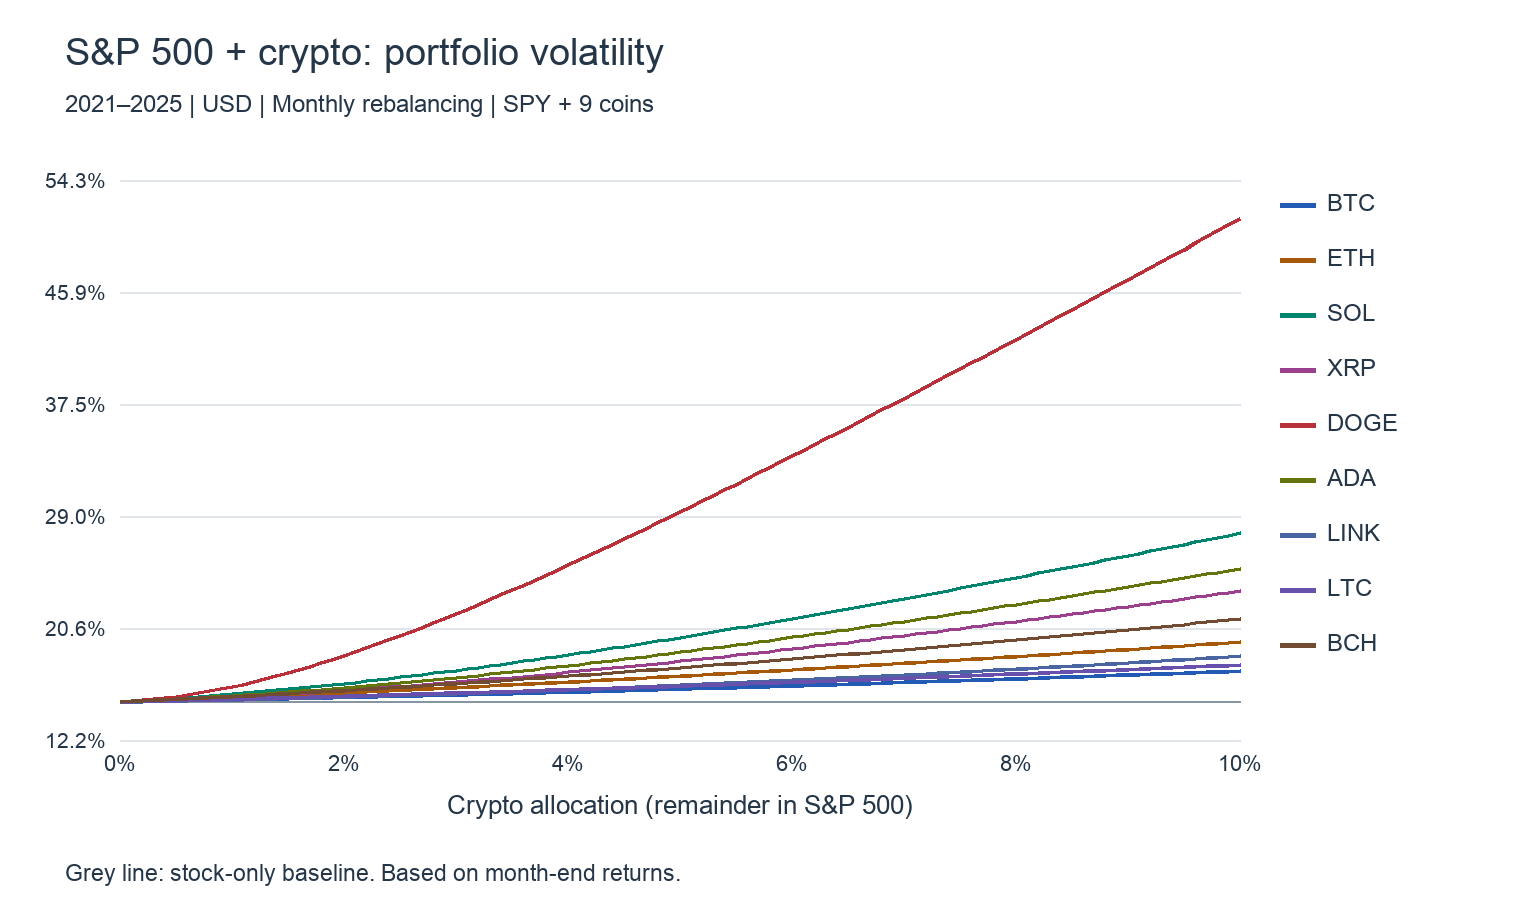
Zooming into small weights does not change the result. Correlation matters, but so does the coin’s own volatility. Portfolio variance is (1−w)²σstocks²+w²σcrypto²+2w(1−w)ρσstocksσcrypto. To lower volatility by adding a little crypto to an all-stock portfolio, ρ×σcrypto must be below σstocks. None of these nine coins met that condition.
DOGE makes the point clearly. Its 0.116 stock correlation was the lowest, yet its 5%-allocation volatility was the highest at 29.36%. Huge monthly moves, including the 2021 surge, dominate the calculation. “It moves differently” is only half an explanation. Portfolio analysis measures both how differently it moves and how large those moves are.
At a fixed 5% weight, which coin adds the least risk?
All coins tie at zero weight for minimum risk. We therefore rank the comparable 95% stock / 5% crypto portfolios by volatility. This is a ranking of least additional risk, not demonstrated risk reduction.
| Rank at 5% | Coin | Stock correlation | Portfolio volatility | Added risk (pp) | Sharpe |
|---|---|---|---|---|---|
| 1 | BTC | 0.488 | 16.10% | +0.96 | 0.793 |
| 2 | LTC | 0.523 | 16.32% | +1.18 | 0.692 |
| 3 | LINK | 0.322 | 16.38% | +1.24 | 0.769 |
| 4 | ETH | 0.532 | 17.06% | +1.93 | 0.806 |
| 5 | BCH | 0.445 | 17.69% | +2.55 | 0.773 |
| 6 | XRP | 0.275 | 18.18% | +3.04 | 0.898 |
| 7 | ADA | 0.280 | 18.86% | +3.72 | 0.818 |
| 8 | SOL | 0.287 | 19.95% | +4.82 | 1.075 |
| 9 | DOGE | 0.116 | 29.36% | +14.22 | 0.906 |
BTC raises volatility from 15.14% to 16.10%, an increase of 0.96 percentage points. LTC and LINK follow. ETH reaches 17.06%; SOL reaches 19.95%. BTC’s 0.488 correlation is higher than XRP’s or SOL’s, yet its portfolio volatility is lower because its standalone moves were smaller. For a stock-centered board that also follows crypto, BTC is my first comparison anchor. The whole-portfolio effect is more useful than searching only for the lowest correlation.
SOL tops full-sample Sharpe, not stability
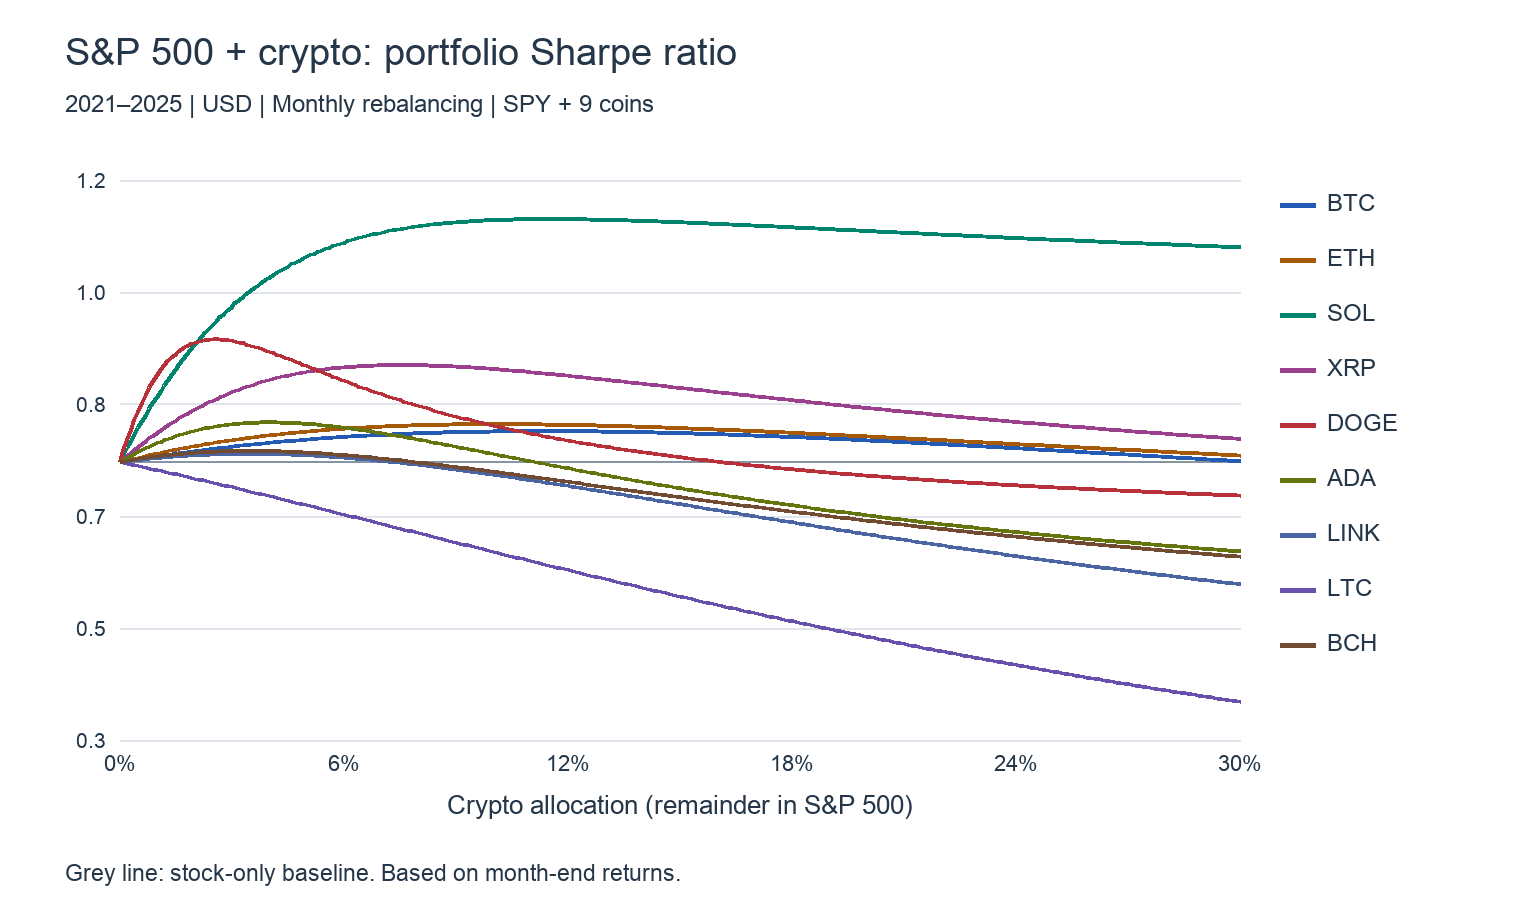
In 2021–2025, a weight of 11.5% SOL produced the highest optimized Sharpe among the nine coins: 1.134. Volatility was 30.39%, about twice the stock-only figure. This was not a calmer portfolio. It was a portfolio whose historical average excess return more than compensated for greater variation under the Sharpe definition.
BTC peaked at 11.3%, with a 0.806 Sharpe and 17.85% volatility. ETH peaked at 10.1%, with 0.817 and 19.67%. The SOL optimum had 39.19% CAGR but a 34.63% month-end maximum drawdown. Sharpe does not directly cap the depth of a loss. Read volatility and drawdown after finding a high Sharpe.
| Coin | 2021–25 peak weight | Peak Sharpe | 2023–25 peak weight | Peak Sharpe |
|---|---|---|---|---|
| BTC | 11.3% | 0.806 | 13.7% | 1.547 |
| ETH | 10.1% | 0.817 | 0.0% | 1.402 |
| SOL | 11.5% | 1.134 | 4.8% | 1.506 |
| XRP | 7.5% | 0.908 | 1.8% | 1.436 |
| DOGE | 2.6% | 0.948 | 0.0% | 1.402 |
| ADA | 4.0% | 0.820 | 0.0% | 1.402 |
| LINK | 3.4% | 0.771 | 2.8% | 1.422 |
| LTC | 0.0% | 0.758 | 0.0% | 1.402 |
| BCH | 3.4% | 0.776 | 2.7% | 1.442 |
These maxima select weights after seeing each entire period. They are not trading signals available at its beginning. Rather than transplanting a result containing SOL’s early 2021 expansion into a future target weight, change the window and inspect which rankings survive.
The recent three-year window clarifies BTC’s position
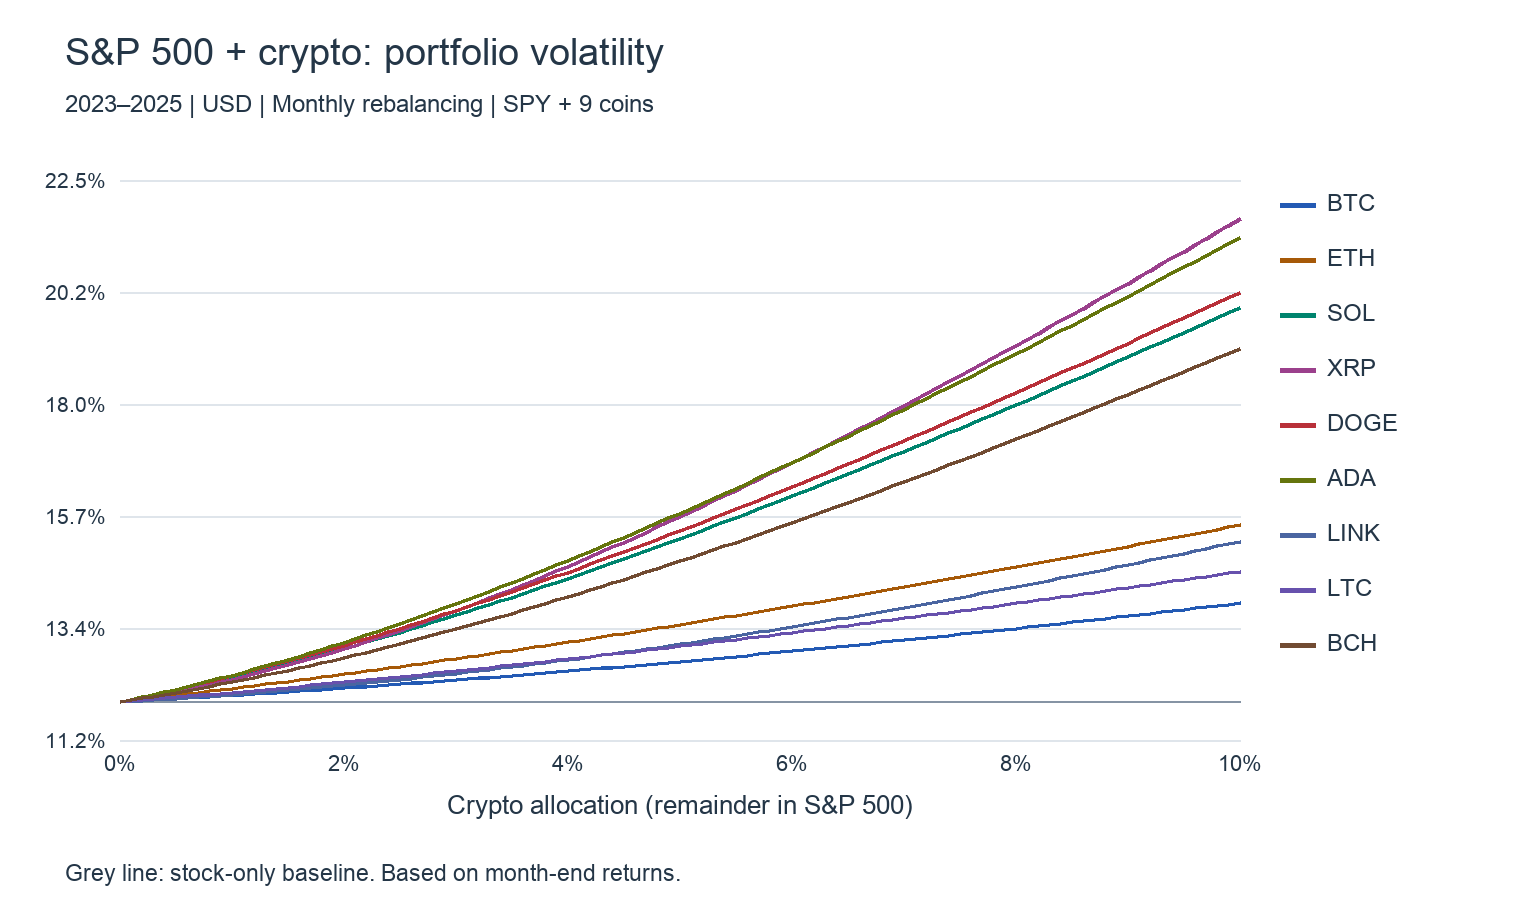
For 2023–2025, stock-only volatility was 11.95%. At 5%, BTC reached 12.77%, again the smallest increase. Every minimum-risk coin weight remained zero. The consistent finding across both windows is not “BTC reduces risk,” but “BTC added the least volatility among equal small crypto allocations.”
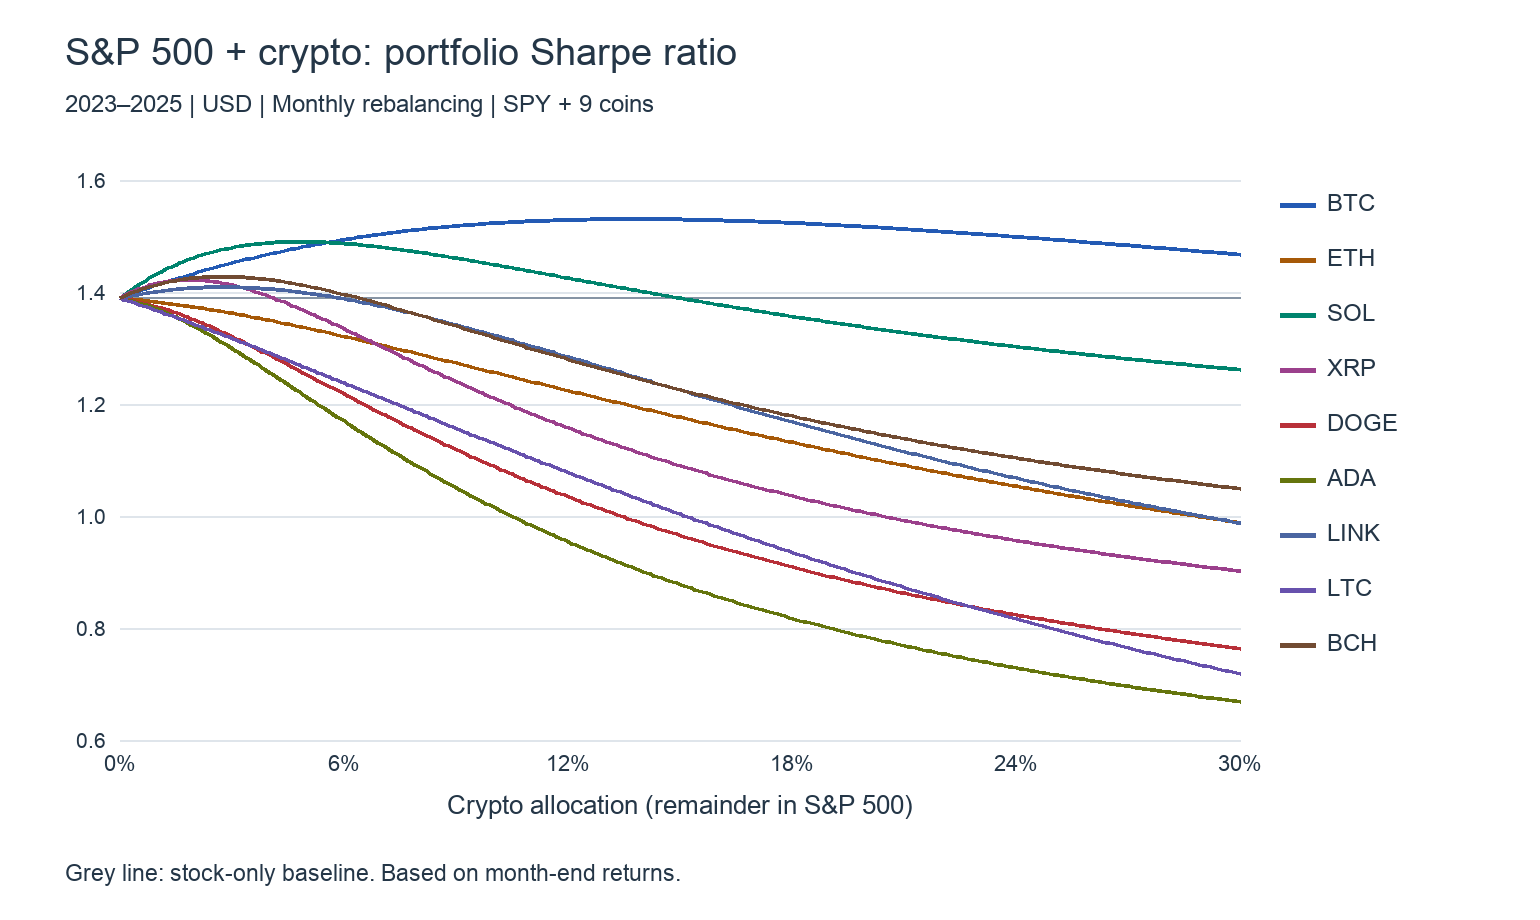
The stock-only Sharpe was 1.402. BTC peaked at 13.7% and 1.547; SOL peaked at 4.8% and 1.506. SOL led the five-year Sharpe comparison, while BTC led the recent three years. ETH, DOGE, ADA and LTC had their recent optimum at 0%, failing to improve on stock-only Sharpe. Compatibility is not permanently attached to a ticker: it comes from price variation and returns in a particular window.
| Period | Allocation | Volatility | Sharpe |
|---|---|---|---|
| 2021–2025 | Stocks only | 15.14% | 0.758 |
| 2021–2025 | BTC 5% | 16.10% | 0.793 |
| 2021–2025 | ETH 5% | 17.06% | 0.806 |
| 2021–2025 | SOL 5% | 19.95% | 1.075 |
| 2021–2025 | DOGE 5% | 29.36% | 0.906 |
| 2021–2022 | Stocks only | 18.84% | 0.183 |
| 2021–2022 | BTC 5% | 19.90% | 0.157 |
| 2021–2022 | ETH 5% | 21.39% | 0.328 |
| 2021–2022 | SOL 5% | 25.78% | 0.746 |
| 2021–2022 | DOGE 5% | 42.89% | 0.875 |
| 2023–2025 | Stocks only | 11.95% | 1.402 |
| 2023–2025 | BTC 5% | 12.77% | 1.497 |
| 2023–2025 | ETH 5% | 13.51% | 1.347 |
| 2023–2025 | SOL 5% | 15.24% | 1.506 |
| 2023–2025 | DOGE 5% | 15.40% | 1.261 |
The 2021–2022 window includes both early surges and deep subsequent losses. SOL alone had a 95.27% month-end maximum drawdown, yet 100% SOL maximized Sharpe in that window. A few exceptional positive months lift the arithmetic average. This contrast explains why a Sharpe maximum alone should not determine a real allocation. Decide whether the goal is growth with more risk or a calmer equity portfolio, then read the appropriate statistic.
Using this board: shared selloffs and persistent leadership
Place S&P 500 beside BTC, then add ETH and SOL. If stocks and crypto fall together during the U.S. session, shared withdrawal of risk-taking capital is a useful hypothesis to investigate. If stocks recover but BTC does not, or BTC recovers while SOL remains weak, the gap helps separate broad market factors from crypto-specific ones.
The board’s crypto charts use a 24-hour comparison, while stocks use their session and previous-close reference. Printed percentages do not share the same starting time. Follow the common live U.S. trading window, rather than treating weekend crypto moves and closed stock charts as contemporaneous returns. A handful of short-term opposite moves is also different from the multi-year monthly correlation calculated here.
A higher-Sharpe mix does not need to move in opposite directions every day. BTC sometimes moved with equities while historical excess returns compensated for added risk. Follow the frequency of joint selloffs and the persistence of recoveries, not just powerful rallies. Linking those observations to allocation statistics turns a collection of favorite coins into a portfolio design.
The verdict: stocks alone for minimum risk; BTC as the crypto anchor
For minimum volatility, the winner was 0% crypto. At an equal 5% crypto weight, BTC ranked first. SOL led full-sample historical Sharpe; BTC led the recent window. My conclusion is to treat crypto as a measured growth allocation around a stock core, not automatically as equity protection. The first step toward the “strongest combination” is deciding what strong means.
Data and calculations
Yahoo Finance supplied dividend-adjusted SPY daily prices and USD daily closes for each coin. December 2020 provides the initial value; returns end in December 2025. Each month samples crypto on the same calendar date as the last U.S. stock trading day, rather than adding a calendar-month-end weekend on the crypto side. Crypto UTC daily closes and U.S. Eastern stock closes still differ by three to four hours. This is a monthly allocation comparison, not perfectly synchronized intraday correlation.
Portfolio monthly returns are (1−w)rstocks+wrcrypto. Volatility is sample standard deviation times √12. Sharpe is mean monthly excess return divided by its sample standard deviation, times √12. The cash proxy is FRED TB3MS, using the previous month’s annual three-month Treasury bill rate divided by 12. CAGR is cumulative growth raised to 12/months, minus one. Maximum drawdown uses month-end wealth and includes the initial value in the running peak; daily and intraday drawdowns may be deeper.
Trading costs, taxes, staking rewards, lending income and yen currency effects are excluded. SPY dividends are included through adjusted prices. The universe is nine coins currently on this site, not an industry-wide return including disappeared tokens. Calculated October 11, 2026.
Data and references
- SEC — Spot Bitcoin ETP approval, January 10, 2024
- SEC — Spot Ether ETP exchange rule approval, May 23, 2024
- Bitcoin — Origins and peer-to-peer design
- Ethereum — History and mainnet launch
- Solana — Mainnet beta in 2020
- XRP Ledger — History
- Chainlink — Oracle networks
- Dogecoin — Project overview
- Cardano — Project overview
- Litecoin — Project overview
- Bitcoin Cash — Peer-to-peer electronic cash
- Yahoo Finance — SPY adjusted price history
- Yahoo Finance — USD crypto history (BTC; also ETH, SOL, XRP, DOGE, ADA, LINK, LTC, BCH)
- FRED — Three-month Treasury bill rate, TB3MS