At what point could you stop contributing to a NISA? For an investor holding an all-country equity fund, the answer depends on how much the portfolio must pay and for how long. We model a demanding case: stop adding money and begin funding living expenses immediately, using Japanese spending statistics for singles, couples with children and retired couples.
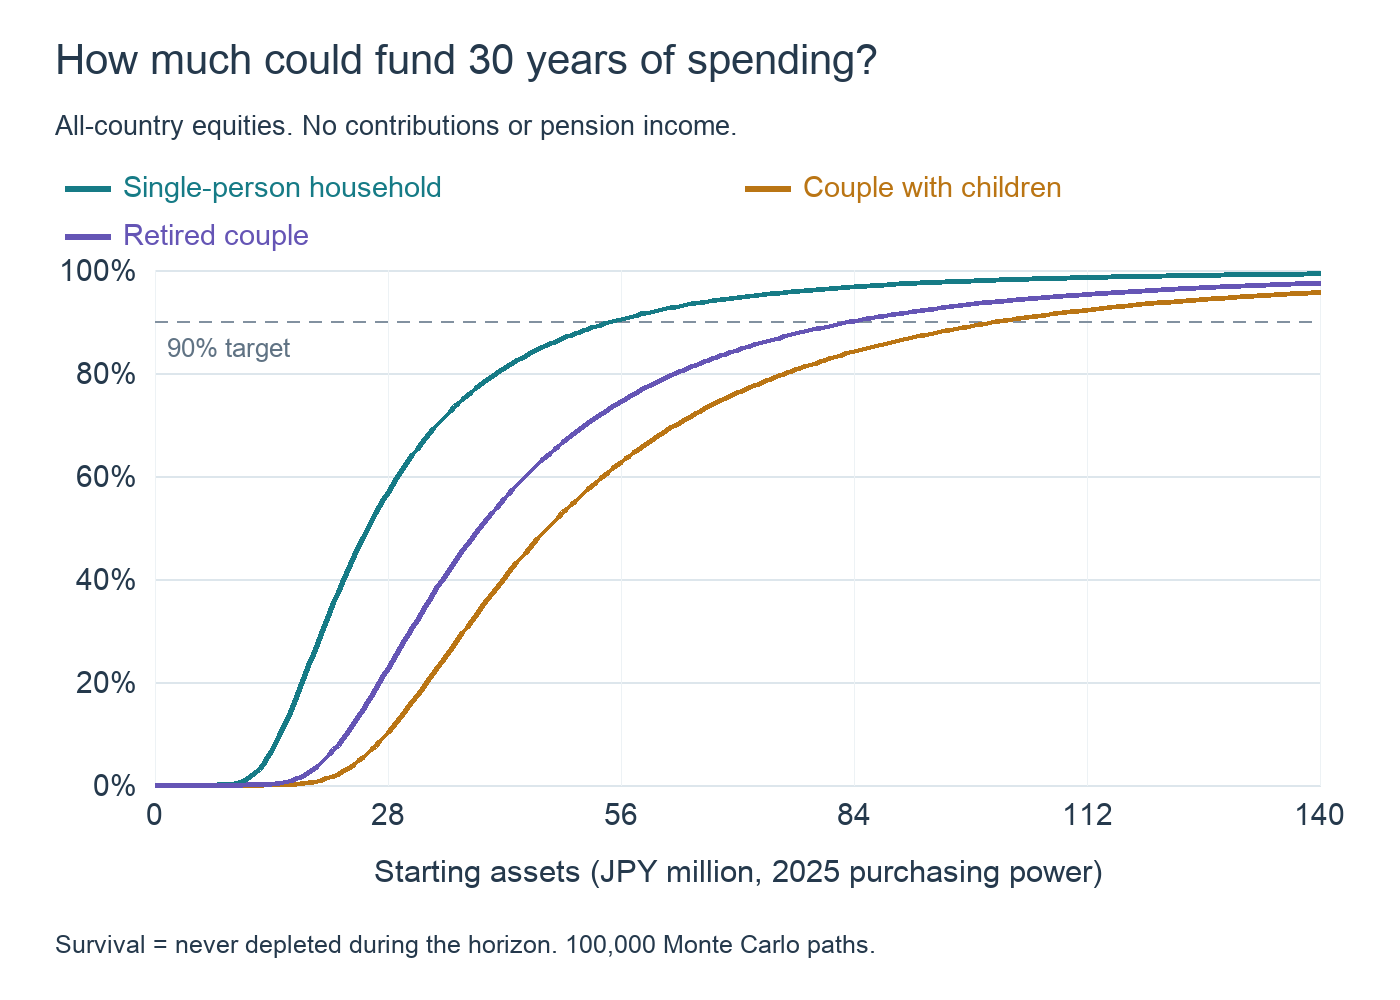
In the baseline model, a 90% chance of funding 30 years requires approximately JPY 55 million for a single-person household, JPY 102 million for a couple with children, and JPY 84 million for a retired couple. If the retired couple needs investments only to cover the gap after net pension and other income, the corresponding amount is JPY 14 million. These are model targets in 2025 purchasing power. A 90% result still leaves roughly one in ten simulated paths depleted.
Define what “enough” means
Survival means paying the specified expenses without running out at any point and retaining a positive balance at the end. It does not mean preserving the original principal or leaving a fixed inheritance. A small final balance counts as survival. A finite horizon cannot establish an amount that will last forever.
Stopping contributions while earnings continue to cover spending is a different problem from stopping work and living on investments. Our main cases resemble the latter. We then add a retirement-income case to show why the amount the portfolio actually needs to supply matters more than total household consumption.
The NISA limit measures acquisition cost
The Financial Services Agency explains that the lifetime tax-exempt holding limit is JPY 18 million per person at acquisition cost, with a combined annual investment limit of JPY 3.6 million. Appreciation can take the market value above JPY 18 million without that alone ending the exemption. The funding targets in this article are market values at the start of withdrawals. They do not mean that JPY 55 million can be newly deposited into a NISA at once.
Couples hold accounts in their individual names, while these calculations concern the household’s combined funding need. If taxable assets contribute to that total, their taxes require a separate adjustment. Filling the available NISA allowance and having enough to fund living costs are different milestones.
Three Japanese household budgets
| Household / case | Monthly withdrawal | Annual withdrawal |
|---|---|---|
| Single-person household | JPY 173,042 | JPY 2.1m |
| Couple with children | JPY 319,389 | JPY 3.8m |
| Retired couple | JPY 263,979 | JPY 3.2m |
| Retired couple: income gap | JPY 42,435 | JPY 0.5m |
The 2025 Family Income and Expenditure Survey reports monthly consumption of JPY 173,042 for single-person households and JPY 263,979 for non-working couples both aged 65 or above. The single-person category includes older residents; it is not a statistic restricted to unmarried working-age people. The older-couple average likewise is not a budget tailored to every newly retired household.
For the family illustration, the 2024 National Survey of Family Income, Consumption and Wealth reports JPY 309,485 per month for workers’ households comprising a couple and two children, with the eldest in elementary or junior high school. Adjusting by the 3.2% rise in Japan’s all-items CPI in 2025 gives about JPY 319,389 in 2025 purchasing power. This is a price-adjusted assumption, not a measured 2025 value for that household category. It represents one household type with two children.
Consumption excludes separate taxes, social insurance payments, mortgage principal and imputed rent for owner-occupied homes. Add costs relevant to your circumstances, including urban rent, education, home purchases, care and major repairs. The family graphs maintain the same real spending level for comparison; they do not forecast child-rearing costs continuing for 50 years. Children leaving home and changes in employment require a phased household plan.
Global equities in real yen
Orukan is an all-country equity mutual fund covering Japan as well as overseas markets. Following the manager’s description of its benchmark, we use MSCI ACWI in yen as the historical proxy. Our series is net total return, reinvesting dividends after withholding tax. It is not the fund’s actual NAV. Currency exposure is unhedged, so yen movements are already included.
The continuous dividend-inclusive monthly history we could retrieve and verify from MSCI’s public data runs from a December 2000 starting level through December 2025: 300 monthly returns for 2001–2025. That provides 25 years rather than only the fund’s short operating history. The index factsheet describes history beginning in December 1987, but this public download did not supply a continuous dividend-inclusive series before 2000. Pre-launch history before 1990 is itself retrospectively calculated. We do not splice in another investment or a dividend-excluding price index to claim a longer sample; the missing earlier periods remain a source of estimation bias.
We divide each monthly yen return factor by the corresponding change in Japan’s official all-items CPI, then deduct an assumed annual cost of 0.10%. This assumption is not a quote of the fund’s actual management fee. The resulting historical real CAGR is 7.72%, with annualized monthly volatility of 18.02%. Substantial growth came with large fluctuations.
Spending is constant in purchasing power. Future nominal withdrawals therefore rise with inflation rather than remaining fixed in yen. Every asset amount in the graphs is also expressed in 2025 purchasing power.
Monte Carlo paths rather than historical starting dates
We do not count successful historical retirement windows to estimate probabilities. Instead, we randomly select consecutive 12-month blocks of real returns and join them into new paths: 100,000 block-bootstrap Monte Carlo simulations. Blocks retain some of the clustering of declines and rebounds that independent monthly draws would discard. A historical crash can recur several times in a simulated future.
Starting months are sampled uniformly from all 300 observations, with the end of the sample wrapping to its beginning. Block boundaries create new sequences. At the beginning of each month, the portfolio pays its fixed real spending amount; the remainder stays entirely in global equities. There are no new contributions. Once depleted, a path cannot later recover and count as a success.
The sample includes the aftermath of the technology bubble, the financial crisis, the pandemic and the inflation/rate shock. Calendar 2008 lost approximately 53.3% in real terms including our assumed cost. Resampling observed history does not automatically generate unprecedented losses or decades of lower growth. We examine reduced returns separately below.
Singles: the same balance supports different horizons
| Starting assets | 20 years | 30 years | 40 years | 50 years |
|---|---|---|---|---|
| JPY 18.0m | 31.9% | 21.1% | 17.5% | 16.0% |
| JPY 30.0m | 74.3% | 61.9% | 56.1% | 53.3% |
| JPY 50.0m | 93.6% | 87.3% | 83.5% | 81.2% |
| JPY 80.0m | 98.5% | 96.2% | 94.5% | 93.3% |
| JPY 100.0m | 99.3% | 98.0% | 96.9% | 96.1% |
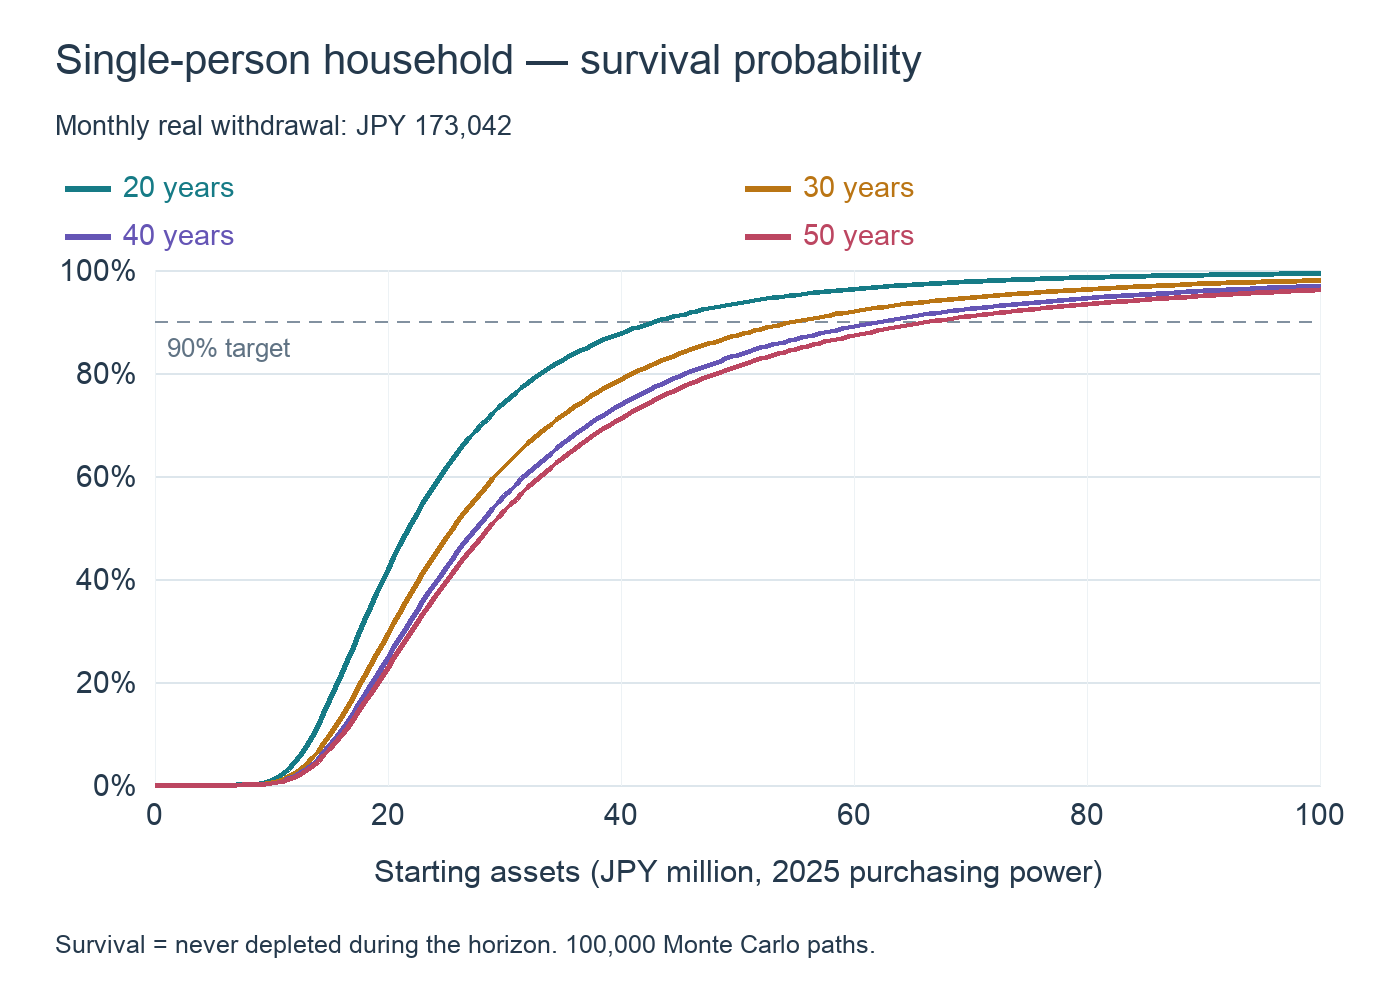
At monthly spending of approximately JPY 173,000, JPY 50 million survives with model probabilities of 93.6% over 20 years, 87.3% over 30 years and 81.2% over 50 years. The 90% funding target is JPY 55 million for 30 years and JPY 67 million for 50 years. A JPY 18 million market-value balance has a 21.1% probability of funding the entire 30-year budget under these conditions.
Living alone does not by itself imply that a small balance is sufficient. Identify the income shortfall and its duration. If earnings reliably fund half the expenses, portfolio withdrawals halve; required starting assets also halve in this fixed-spending model.
Families: funding the whole budget is demanding
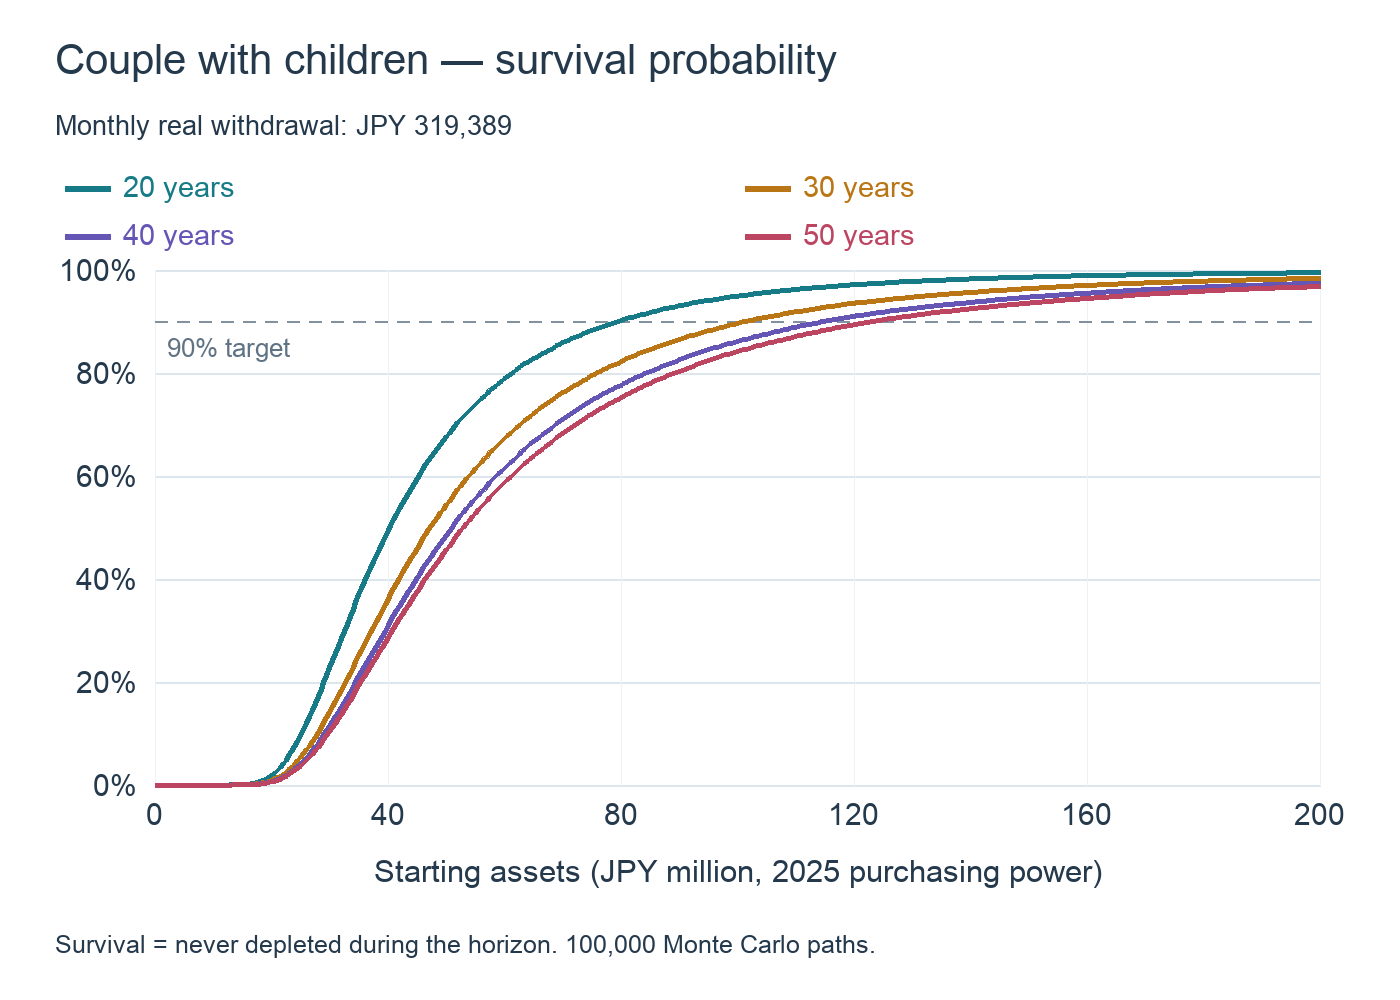
Funding approximately JPY 320,000 per month entirely from investments requires JPY 102 million for a 30-year 90% target, or JPY 124 million for 50 years. Those figures assume no salaries or child-related benefits. They illustrate the burden of replacing all household consumption, rather than a conclusion that families cannot make useful progress through NISA.
Education costs, children leaving home and the number of remaining working years change the funding need. Money earmarked for tuition soon can require selling more shares during a downturn if held entirely in equities. A plan separating near-term commitments from long-term investments requires its own calculation beyond this all-equity comparison.
Retired couples: subtract reliable net income
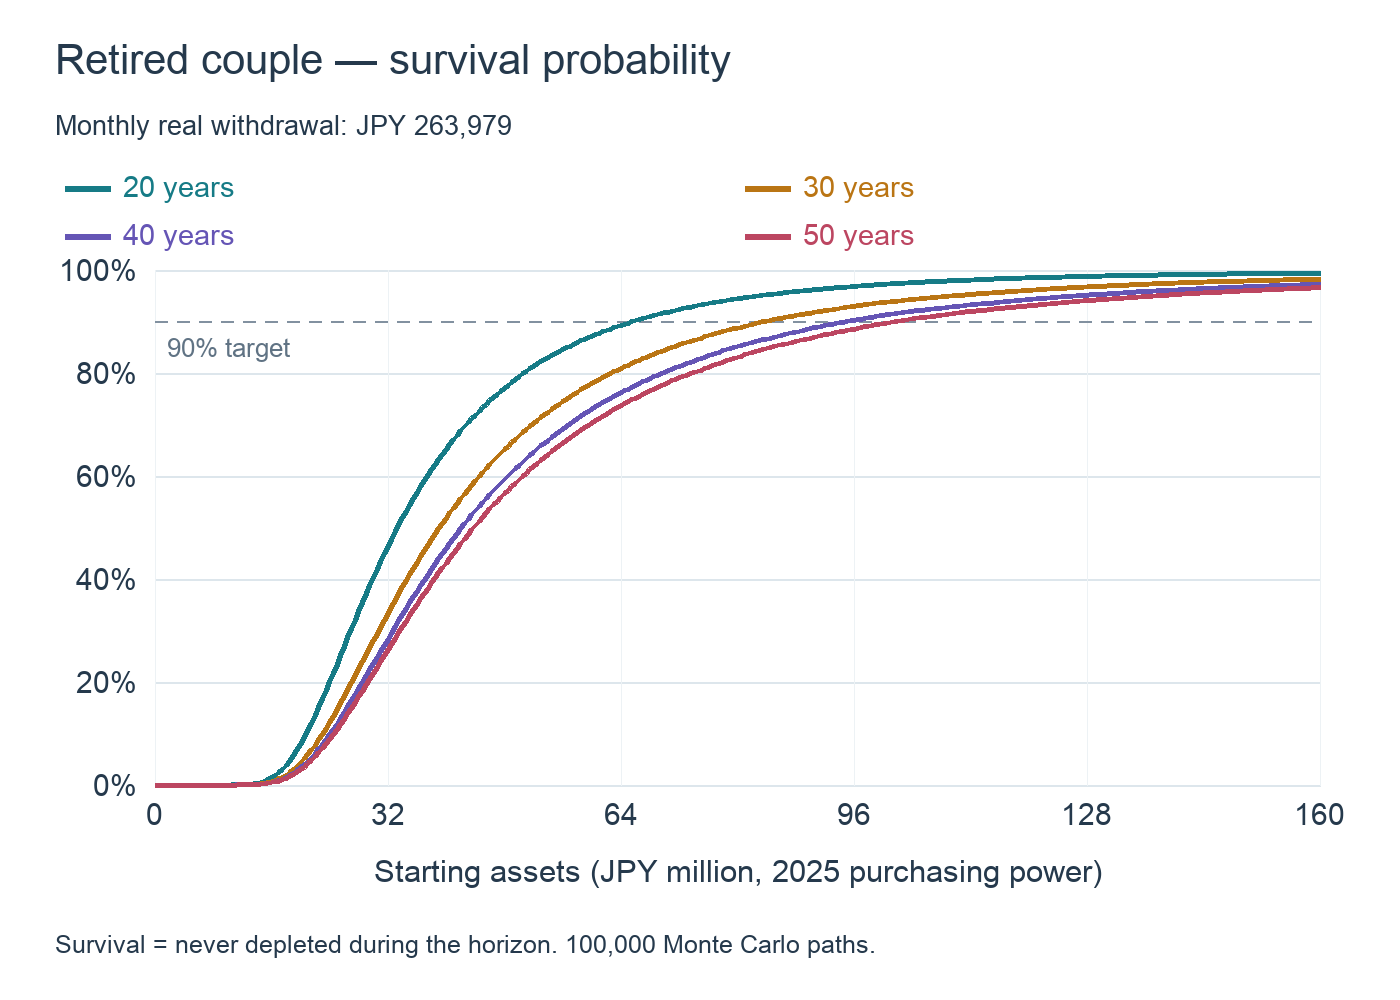
Without pension income, monthly consumption of JPY 263,979 requires JPY 84 million for the 30-year 90% target. The same 2025 statistics report disposable income of JPY 221,544, leaving a consumption gap of JPY 42,435 per month, or roughly JPY 509,000 per year. Investments may need to fund this gap rather than the whole budget.
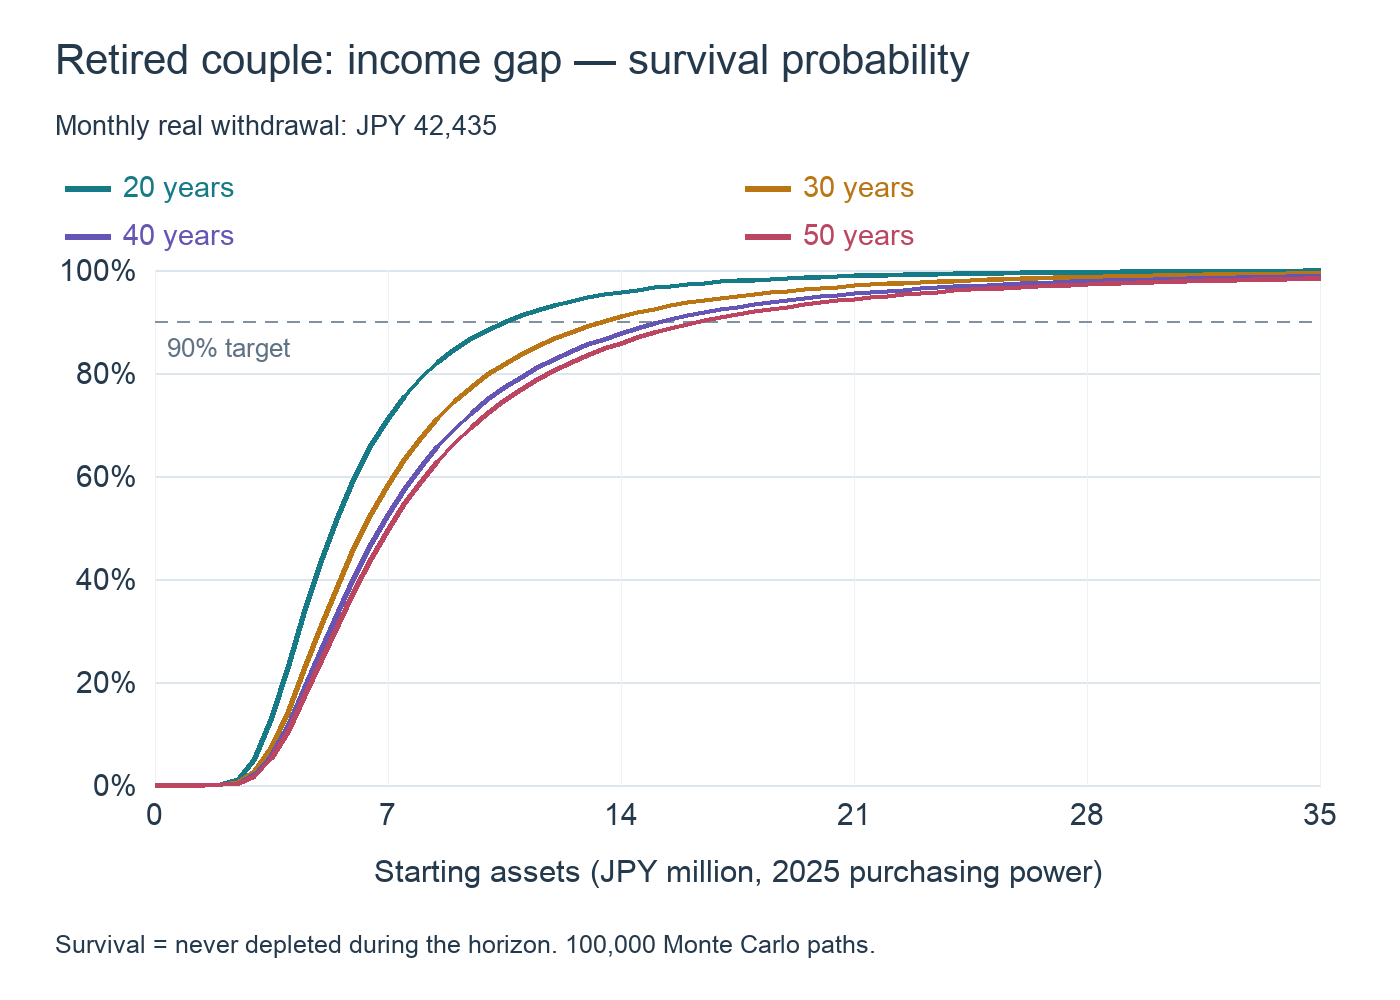
Funding only that gap requires JPY 14 million for 30 years or JPY 17 million for 50 years at the 90% target. Disposable income already reflects the taxes and social insurance in the statistic, so we do not add them twice. Both consumption and net income are assumed constant in real terms. If pension increases lag inflation, the gap grows. Care or major repairs add further demands. Substitute your own expected net pension rather than assuming this average applies to you.
Start with 90%, then choose your own target
| Household / case | 20 years | 30 years | 40 years | 50 years |
|---|---|---|---|---|
| Single-person household | JPY 44.0m | JPY 55.0m | JPY 63.0m | JPY 67.0m |
| Couple with children | JPY 80.0m | JPY 102.0m | JPY 115.0m | JPY 124.0m |
| Retired couple | JPY 66.0m | JPY 84.0m | JPY 95.0m | JPY 102.0m |
| Retired couple: income gap | JPY 11.0m | JPY 14.0m | JPY 16.0m | JPY 17.0m |
| Household / case | 80% | 90% | 95% | 99% |
|---|---|---|---|---|
| Single-person household | JPY 42.0m | JPY 55.0m | JPY 72.0m | JPY 127.0m |
| Couple with children | JPY 76.0m | JPY 102.0m | JPY 133.0m | JPY 235.0m |
| Retired couple | JPY 63.0m | JPY 84.0m | JPY 110.0m | JPY 194.0m |
| Retired couple: income gap | JPY 11.0m | JPY 14.0m | JPY 18.0m | JPY 32.0m |
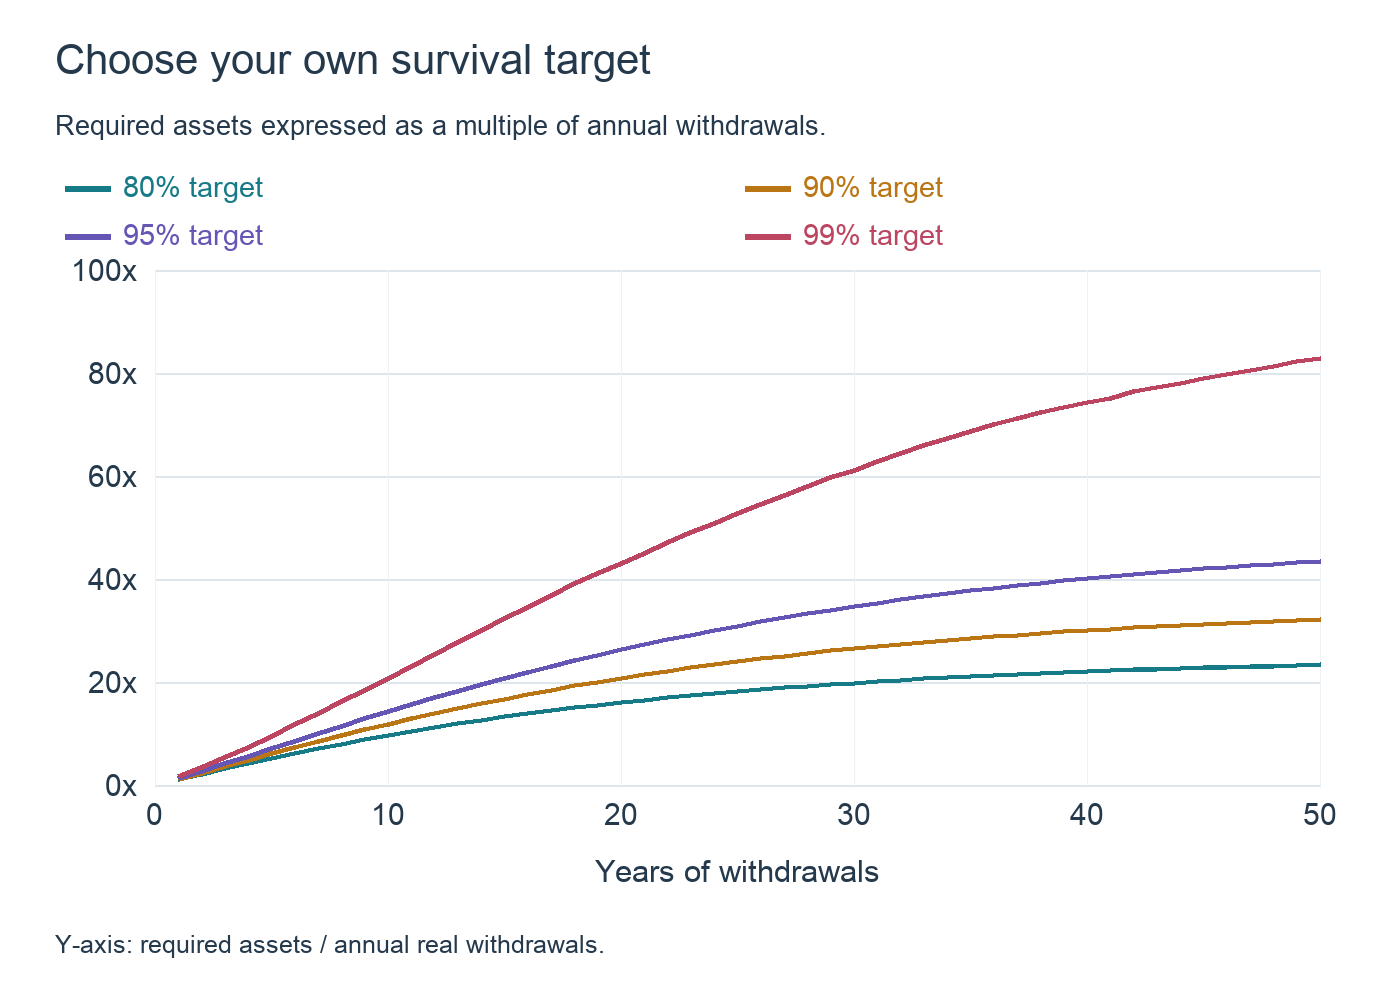
For a single-person household over 30 years, an 80% target requires JPY 42 million; 90% requires JPY 55 million; 95% requires JPY 72 million; and 99% requires JPY 127 million. Higher targets demand enough capital to withstand more persistently unfavorable paths. Even 99% is not a guarantee, and the result is sensitive to how extreme sample outcomes enter the model.
Someone able to earn more or reduce spending can choose differently from someone who must maintain fixed withdrawals. Use 90% as an initial planning benchmark and consider what you would change if your outcome falls into the unsuccessful 10%.
| Horizon | 80% | 90% | 95% | 99% |
|---|---|---|---|---|
| 20 years | 16.0x | 20.7x | 26.2x | 43.0x |
| 30 years | 19.8x | 26.5x | 34.6x | 61.1x |
| 40 years | 22.0x | 30.0x | 40.0x | 74.2x |
| 50 years | 23.3x | 32.1x | 43.5x | 82.9x |
Multiply the amount the portfolio must actually supply each year, rather than gross household spending. The 30-year 90% multiplier is approximately 26.5. A monthly shortfall of JPY 50,000 gives JPY 600,000 × 26.5, or about JPY 15.9 million; a JPY 100,000 shortfall gives about JPY 31.8 million. Cutting spending by 20% reduces required assets by 20% under the same fixed-real-withdrawal assumptions.
Lower future returns raise the funding target
| Horizon | 12-month blocks | Log return −2%/year | 36-month blocks |
|---|---|---|---|
| 30 years | 26.5x | 34.6x | 24.7x |
| 50 years | 32.1x | 47.0x | 29.3x |
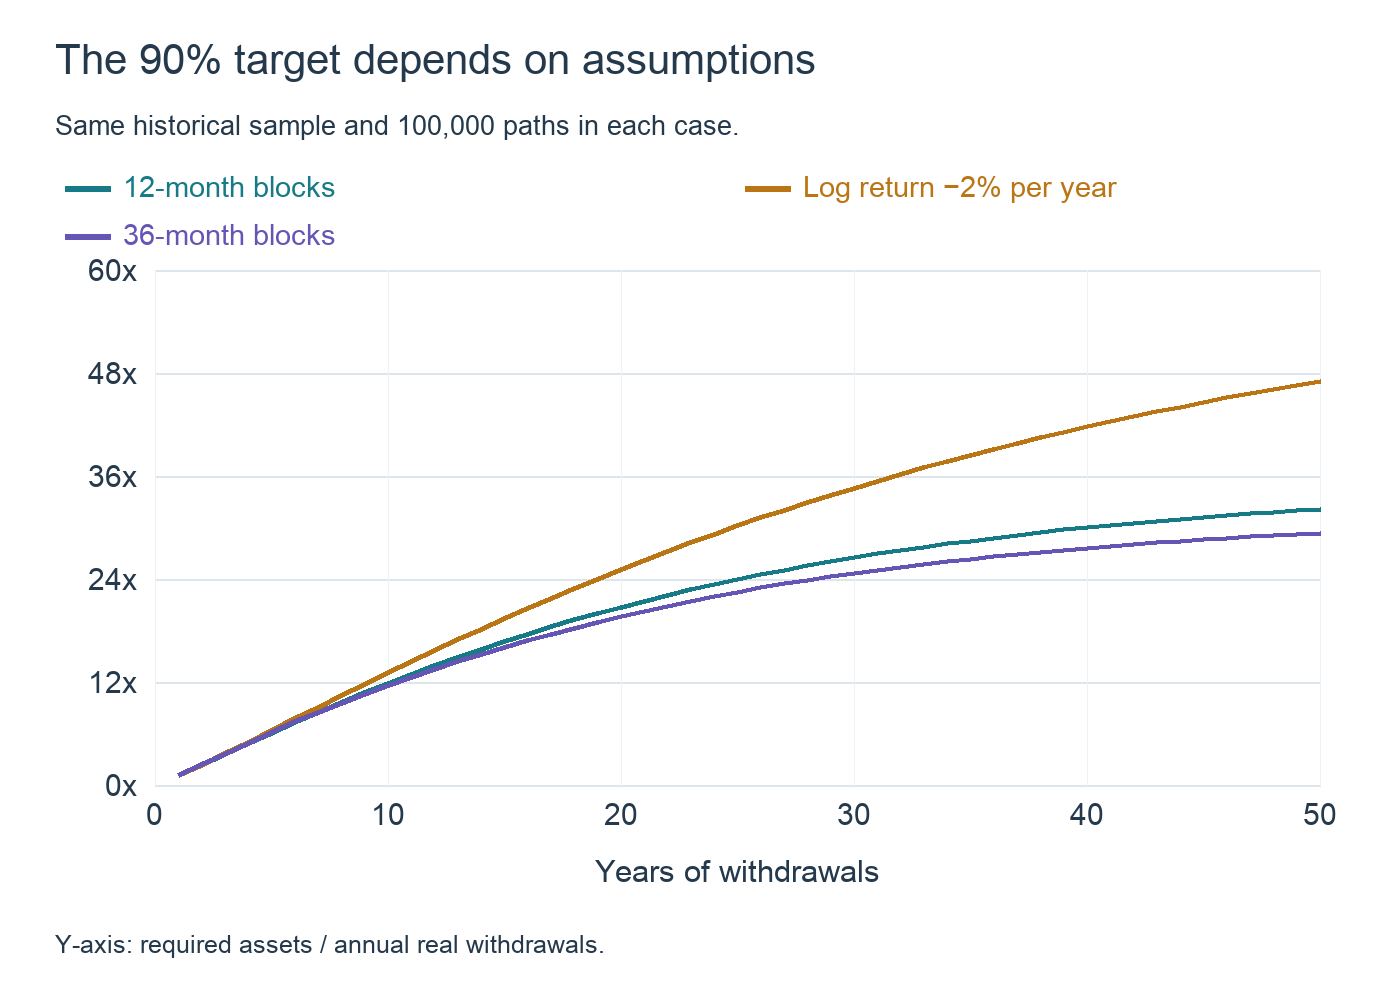
Reducing monthly log growth by an annualized 2% takes the historical real CAGR from 7.72% to an equivalent level of approximately 5.59%. The 90% funding multiple rises from 26.5 to 34.6 over 30 years, and from 32.1 to 47.0 over 50 years. For singles, rounded-up targets rise from JPY 55 million to about JPY 72 million for 30 years, and from JPY 67 million to about JPY 98 million for 50 years. Future growth assumptions materially affect what looks sufficient.
Using 36-month blocks produces 90% multiples of 24.7 for 30 years and 29.3 for 50 years, lower than the baseline in this sample. Longer blocks can carry a recovery along with the preceding crash. Increasing block length is therefore not automatically more conservative. Compare horizons, returns and block choices to see a range rather than rely on a single estimate.
Watch weak markets to become comfortable with volatility
Use this site to watch the size of daily declines, particularly during poor markets. Place equity indexes beside USD/JPY to see how falling stocks and a stronger yen can jointly hurt yen-based holdings, or how a weaker yen can cushion part of a decline. The S&P 500, U.S. total-market stocks and the Nikkei are not the all-country fund itself; their movements help illustrate timing and scale.
Track daily losses, declines from previous highs and renewed selling after rebounds. Apply those percentages to your own balance and translate the fluctuation into months of spending. That makes annualized volatility near 18% more tangible. Regular observation can help prevent every short-term move from feeling like a crisis and reduce the temptation to react to volatility.
Early losses during withdrawals force the sale of more shares, leaving less capital to participate in a recovery. After reaching a target, continue reviewing spending, expected pension income and the remaining horizon. Decide your probability target and prepare spending adjustments and cash reserves before a downturn so that daily observation supports a considered plan.
Calculation details
Data and calculations were completed on October 7, 2026. We align month-end MSCI ACWI JPY net total-return observations from December 2000 to December 2025 with Japan’s linked monthly all-items CPI on the 2020 base. Monthly real growth equals the index month-end ratio divided by the CPI ratio, multiplied by exp(−0.001/12). No missing values are interpolated. Calendar-year real returns multiply the corresponding 12 monthly factors.
The baseline uses circular 12-month blocks, 100,000 paths per case, up to 600 months and random seed 20261007. Withdrawals occur before each month’s investment return. There is no borrowing, additional investment, insurance, cash allocation, trading commission or taxation outside NISA. Dividend withholding is reflected in the net index; investor-level gains inside NISA are assumed tax-exempt. For each path we sum the discounted value of monthly withdrawals at annual spending of one, then use that distribution to calculate survival and starting-capital targets. Positive spending and positive growth factors mean that capital exceeding the final cumulative requirement also avoids depletion at earlier dates.
At a 90% probability, Monte Carlo standard error is approximately 0.095 percentage points, with an approximate 95% sampling margin of ±0.19 points. This concerns random-draw error only, not uncertainty about future markets or spending. Funding targets round upward to the next JPY 1 million; graphs and probability tables use the unrounded distributions. A 50-year simulated path resamples a 25-year history, rather than relying on 50 years of observed returns. Use your own shortfall and horizon, and consider both the baseline and lower-return case.
Data and references
- Financial Services Agency — NISA framework
- Statistics Bureau — 2025 household survey summary
- Statistics Bureau — 2024 national household survey summary
- Statistics Bureau — CPI long-term time series
- MSCI — index history, ACWI / JPY / Net
- Mitsubishi UFJ Asset Management — all-country fund benchmark