A payment every month can help with household budgeting and make investing feel tangible. But buying a fund labelled “monthly distribution” is not the same as choosing a sound investment. Japan now has inexpensive quarterly-distribution funds that can be combined into a monthly calendar without returning to a high-fee, payout-first approach.
The basic design is three groups with staggered quarterly settlement months, weighted by cash received rather than equal amounts invested. Then check geographical concentration and ongoing costs. This article compares six candidates and four allocation designs for Japanese mutual-fund investors. English fund names below are descriptive translations, not separate overseas products.
What Japan’s monthly-distribution history teaches
Demand for regular spending money helped monthly-distribution funds grow. The problem was confusing attractive payments with successful wealth creation. The Financial Services Agency’s 2017 report raised concerns about sales that did not adequately establish investors’ needs. Monthly-distribution products accounted for more than half of Japan’s investment-trust balances; major Japanese products included substantial overseas REIT exposure, unlike the predominantly bond-oriented U.S. equivalents.
The first confusion is distribution equals profit. Cash comes out of fund assets and reduces NAV. Paying more than the investment earns can leave less capital working. A payment may also be classified as a return of capital according to an investor’s individual tax cost basis. That tax classification alone does not determine investment quality. Evaluate remaining assets plus payments received: total return.
The second confusion is higher fees imply better management. The same report found negative ten-year after-management-fee returns in roughly one-third of 281 long-established Japanese equity active funds; 71% lagged the comparison Nikkei 225 index funds. Those statistics are not a monthly-distribution-only sample. They do demonstrate why fees and investment success cannot be treated as equivalents. Regular payments combined with disappointing wealth creation are a recipe for disillusionment with investing.
An FSA review in 2018 showed monthly-distribution products’ share of investment-trust sales at major banks falling from 71% to 43% between the fiscal-2016 and fiscal-2017 observations. Payout reductions and changes in sales practices were part of that transition. A 2021 FSA explanation also identified capital depletion in previously sold monthly-distribution funds as a contributor to continuing asset outflows. Receiving cash and growing wealth must be designed as separate objectives.
Low-cost quarterly funds offer a different toolkit
| Fund | Scheduled settlement | Annual management cost | Exposure |
|---|---|---|---|
| SBI Japan High Dividend Equity (quarterly) | Jan / Apr / Jul / Oct 10 | 0.099% | Japanese equities; active |
| Rakuten U.S. VYM High Dividend Equity (quarterly) | Jan / Apr / Jul / Oct 15 | Approx. 0.172% | U.S. dividend equities; VYM |
| Rakuten Schwab U.S. High Dividend Equity (quarterly) | Feb / May / Aug / Nov 25 | Approx. 0.1238% | U.S. dividend equities; SCHD |
| SBI Global High Dividend Equity (quarterly) | Feb / May / Aug / Nov 20 | 0.055% | Japan, U.S., Europe, emerging markets; active |
| eMAXIS High Dividend All Country Equity (distribution class) | Mar / Jun / Sep / Dec 14 | Up to 0.165% | MSCI ACWI High Dividend Yield Index |
| SBI European High Dividend Equity (quarterly) | Mar / Jun / Sep / Dec 20 | 0.099% | European equities; active |
Use the quarterly Rakuten VYM product, not a similarly named fund with another settlement schedule. Rakuten SCHD’s effective annual management cost became approximately 0.1238% in May 2025: the manager credits an estimated amount corresponding to the underlying ETF’s fee back to the fund. Rakuten VYM’s effective cost is approximately 0.172%, reflecting the underlying ETF fee reduction. The official SCHD change and VYM cost update matter when checking older fund comparisons.
These combinations readily meet a 0.4% annual management-cost ceiling. Management fees are not total ownership costs: trading, custody, audit and other expenses can also apply. Review the fund’s reported total expense ratio when available, rather than assuming the advertised rate includes everything.
Three settlement groups cover the calendar
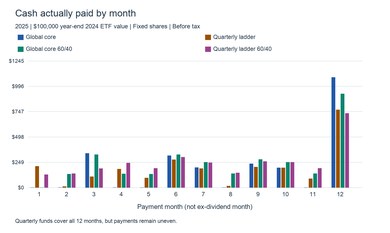
Group A settles in January, April, July and October: Rakuten VYM or SBI Japan. Group B covers February, May, August and November: SBI Global or Rakuten SCHD. Group C covers March, June, September and December: eMAXIS Global High Dividend or SBI Europe. Holding one from each group schedules a settlement in every month.
Settlement month is not necessarily bank-credit month. Check the distributor’s payment arrangements and business-day calendar; a fund settling on the 25th can credit cash around month-end or in the following month. Quarterly settlement also does not promise a payment every time. For a steady spending allowance, keep several months of cash separately, direct fund payments into that account and withdraw a fixed monthly amount. The funds organize the calendar; the cash account stabilizes actual spending.
The eMAXIS distribution class launched on September 30, 2026. Its official policy sets quarterly settlement on the 14th of March, June, September and December, generally distributing dividend and similar income after expenses. As of October 9 it has no distribution history. The following examples are designs for future allocation, not reconstructions of an existing monthly income stream.
Balance cash flows with inverse-rate weights
If the annual cash distribution rate is y and the portfolio weight is w, each equal quarterly payment is capital × w × y / 4. Equal cash payments therefore require weights proportional to 1/y. The lower-paying fund receives more capital.
The design inputs are annual cash rates of 2.0% for Rakuten VYM, 2.5% for SCHD, 3.5% for SBI Global, 3.0% for eMAXIS Global and 3.5% for SBI Japan. These are explicit illustrative assumptions, not forecasts. Each fund pays four equal instalments, capital stays fixed and investor-level tax is excluded. Assumed cash rates are after fund expenses, so management fees are not deducted from the model cash a second time.
For context, Rakuten VYM’s published payments from October 2025 through July 2026 were JPY 55, 60, 60 and 60 per 10,000 units: JPY 235, or 1.75% of the latest settlement’s ex-distribution NAV of JPY 13,441. SCHD’s payments from November 2025 through August 2026 totalled JPY 360 (85, 90, 90 and 95), or 2.57% of JPY 14,018. These observations have different dates and are backward-looking cash ratios, not next-year yields. Recalculate allocations using the purchase NAV and the distribution inputs you actually establish.
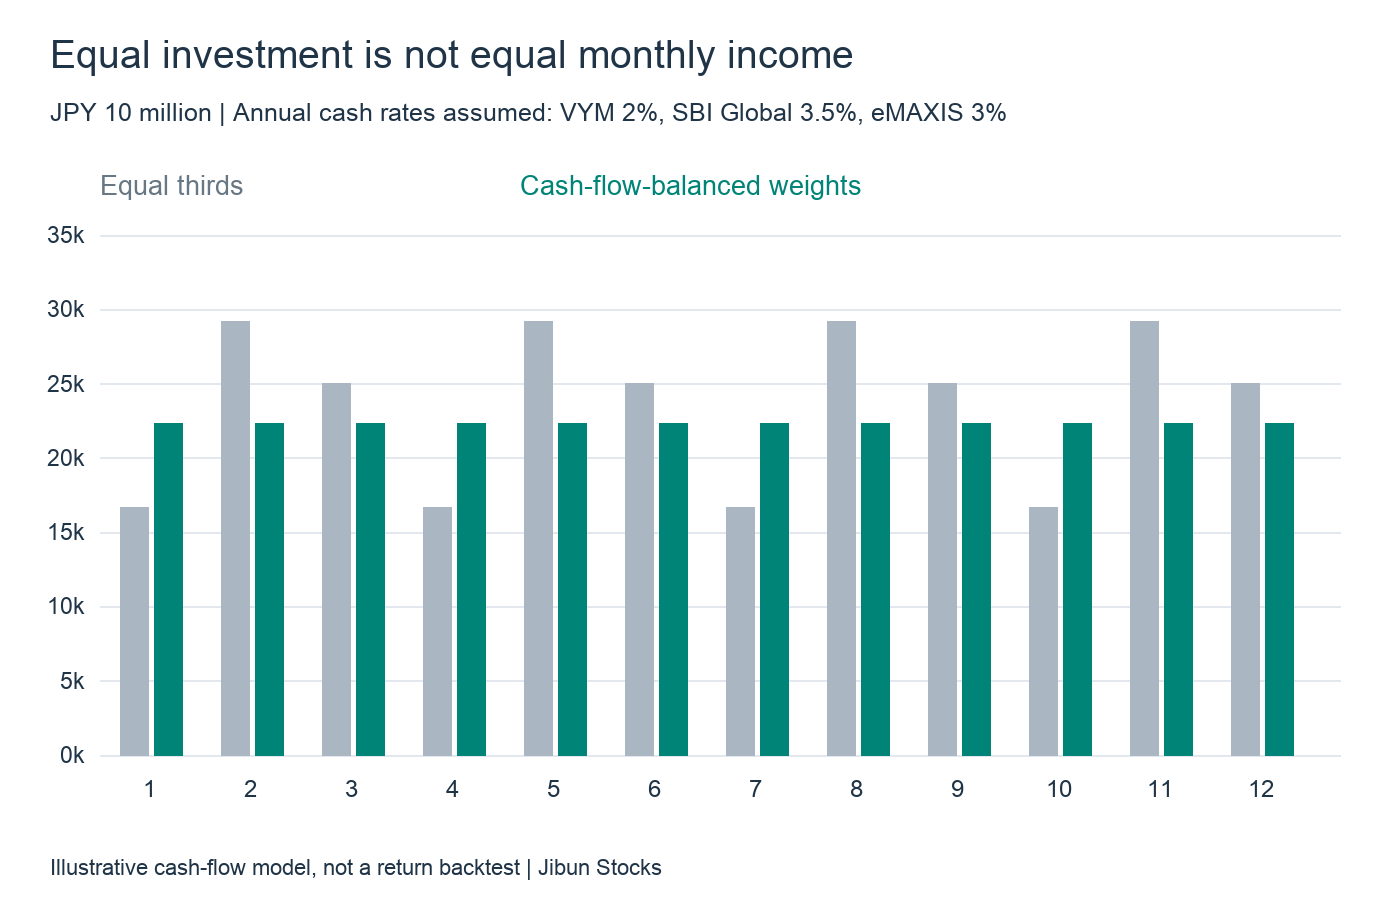
Equal thirds in VYM, SBI Global and eMAXIS Global produce model payments of JPY 16,667 in A months, JPY 29,167 in B months and JPY 25,000 in C months on JPY 10 million. Inverse-rate weights—44.7%, 25.5% and 29.8%—instead produce approximately JPY 22,340 each month. The same calendar can deliver a very different cash-flow pattern.
Four designs for different priorities
| Model | Capital weights | Annual cost | A / B / C cash per month | Cash dispersion |
|---|---|---|---|---|
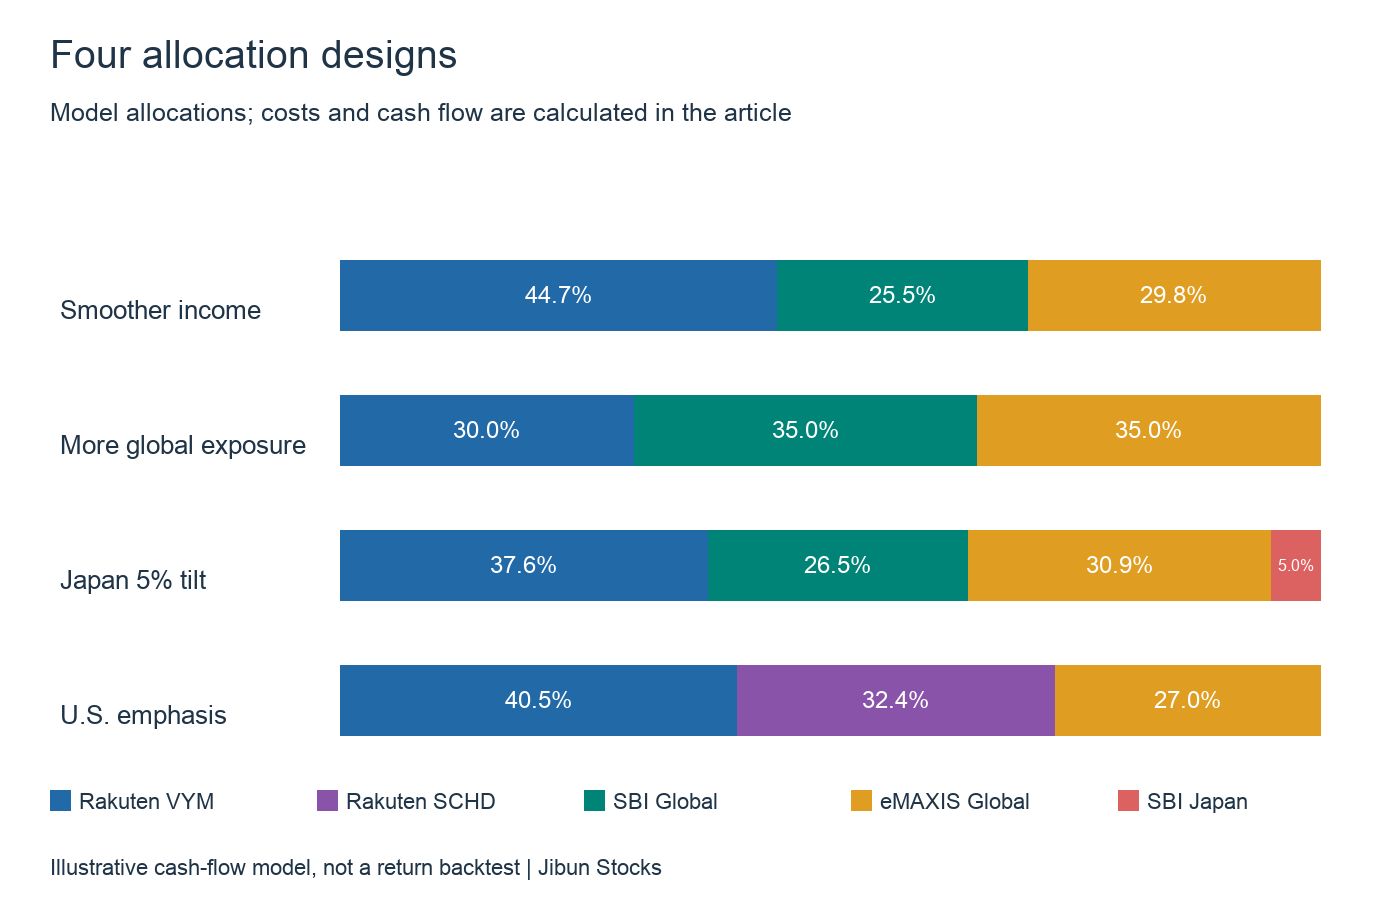
| 1. Smoother income | Rakuten VYM 44.7% / SBI Global 25.5% / eMAXIS Global 29.8% | 0.1400% | ¥22,340 / ¥22,340 / ¥22,340 | 0.0% |
| 2. More global exposure | Rakuten VYM 30.0% / SBI Global 35.0% / eMAXIS Global 35.0% | 0.1286% | ¥15,000 / ¥30,625 / ¥26,250 | 27.5% |
| 3. Japan 5% tilt | SBI Japan 5.0% / Rakuten VYM 37.6% / SBI Global 26.5% / eMAXIS Global 30.9% | 0.1352% | ¥23,178 / ¥23,178 / ¥23,178 | 0.0% |
| 4. U.S. emphasis | Rakuten VYM 40.5% / Rakuten SCHD 32.4% / eMAXIS Global 27.0% | 0.1545% | ¥20,270 / ¥20,270 / ¥20,270 | 0.0% |
1. Smoother income: a three-fund starting point
The inverse-rate combination of VYM, SBI Global and eMAXIS Global has a model annual management cost of about 0.140%. Two global funds extend exposure beyond America to Japan, Europe and emerging markets. SBI Global is actively managed; eMAXIS tracks a high-dividend index. They share a worldwide remit but not the same selection process.
2. More global exposure: accept uneven receipts
VYM 30%, SBI Global 35% and eMAXIS Global 35% puts 70% in global funds and reduces the U.S.-only component. Annual management cost is about 0.129%. Model payments range from JPY 15,000 in A months to JPY 30,625 in B months and JPY 26,250 in C months. A cash account can smooth that spending pattern without forcing the investment allocation to chase identical payouts. Among these designs, this is the most balanced starting point for the article’s geographical-diversification objective.
3. A 5% Japan tilt
Allocate 5% to SBI Japan and balance its A-month cash together with VYM. The resulting allocation is VYM 37.6%, SBI Global 26.5%, eMAXIS Global 30.9% and SBI Japan 5%. Model monthly cash is approximately JPY 23,178, with annual management cost around 0.135%. The actual Japanese-equity share is higher than 5%, because the global funds also hold Japanese companies.
4. U.S. emphasis with SCHD
Replacing the B-month fund with SCHD gives VYM 40.5%, SCHD 32.4% and eMAXIS Global 27.0%. Model monthly cash is about JPY 20,270 and management cost about 0.154% annually. This deliberately emphasizes U.S. dividend equities; it is not a route toward global market-cap weights. Overlapping VYM and SCHD holdings do not count as additional geographical diversification.
Equal monthly cash and market-cap allocation are different goals
A lower assumed VYM cash rate requires a larger VYM allocation to equalize payments, increasing the U.S.-only sleeve. The following graph varies VYM’s weight while dividing the remainder equally between the two global funds. Its vertical axis is monthly cash-flow dispersion: standard deviation divided by the mean. This measures uneven receipts, not investment-price risk.
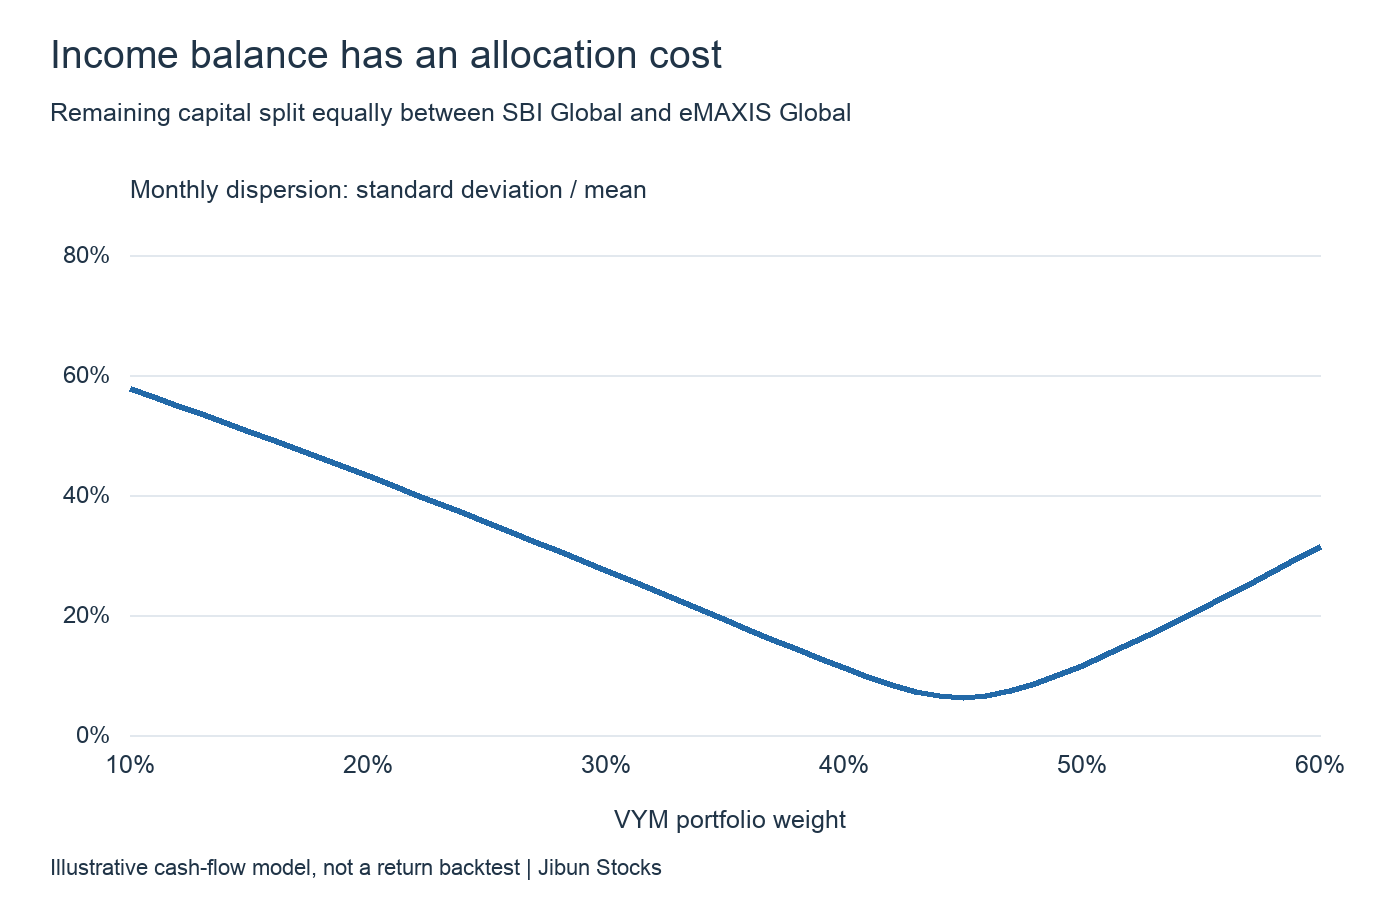
Dividend funds also underweight or exclude many non-dividend and low-dividend growth companies. They are not replicas of broad global market-cap exposure. VYM is capitalization-weighted within an eligible high-dividend universe, not across the entire U.S. market. Global funds help reduce the regional concentration caused by using equally sized Japan-only or Europe-only sleeves, but the dividend-style and sector tilts remain.
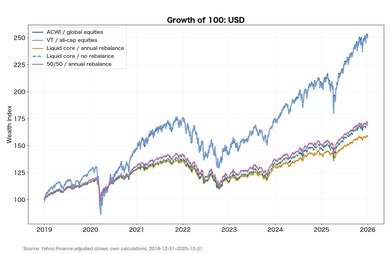
If market-cap exposure is the overriding objective, a conventional global equity core combined with inexpensive scheduled sales is a cleaner design. Rank your priorities—payment frequency, geographical exposure and dividend style—rather than expecting one distribution portfolio to maximize all of them.
Annual fees compound into a meaningful difference
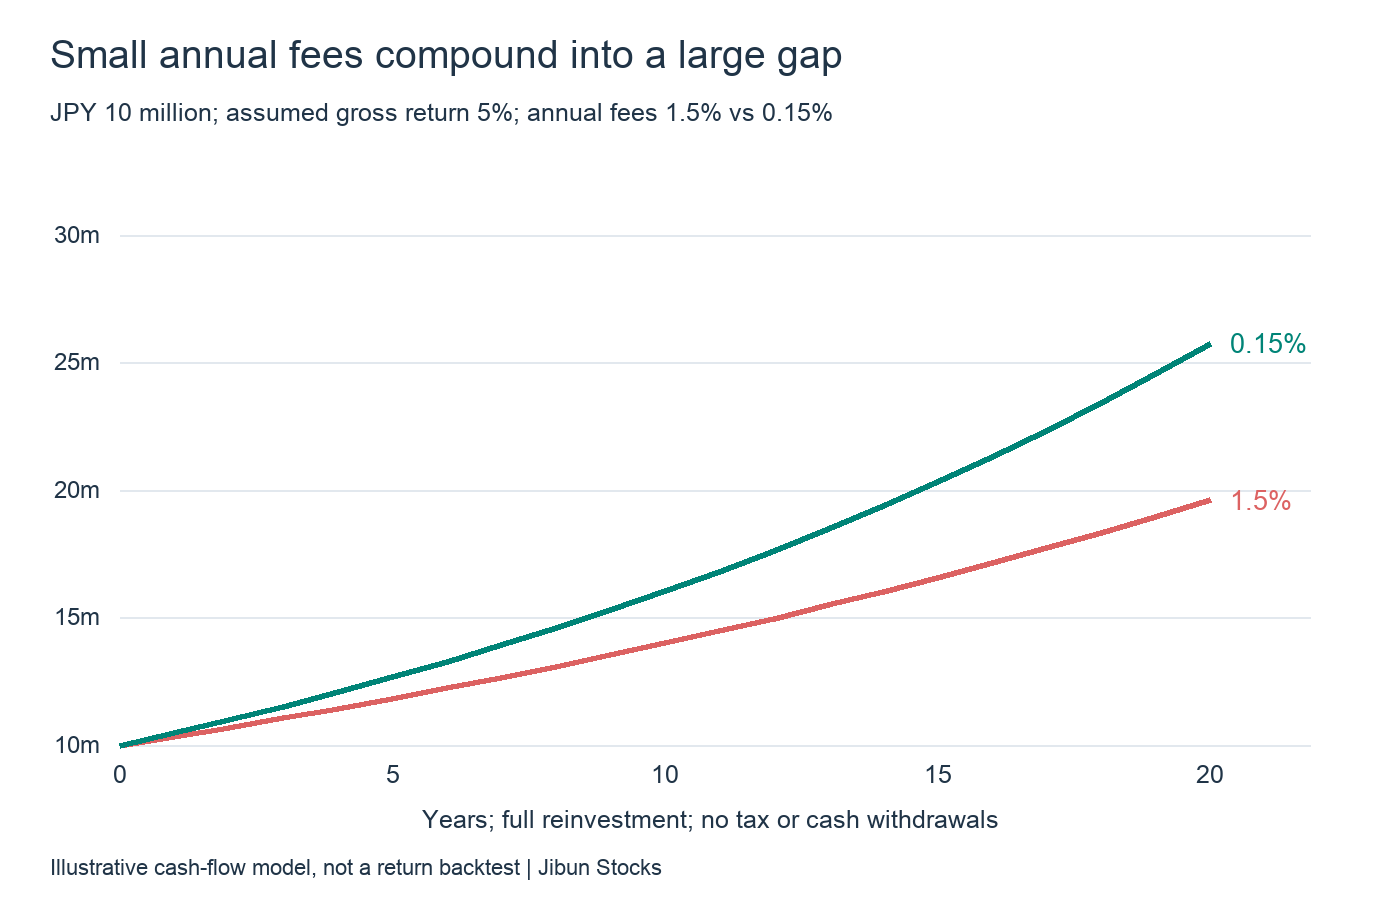
Start with JPY 10 million and assume a constant 5% gross return. Charging 1.5% versus 0.15% of each year-end balance yields approximately JPY 19.61 million versus JPY 25.75 million after twenty years. This is a mechanical illustration, not historical fund performance: 10 million × [1.05 × (1 − fee)] to the twentieth power. Market returns are uncertain; the recurring fee schedule can be compared before purchase.
Add bonds for risk allocation, not calendar convenience
A stock-only portfolio can lose substantial market value even while distributions continue. Adding bonds should first address the desired equity exposure. Substituting a bond fund with matching settlement months does not preserve cash flow automatically: insert its own distribution rate and recalculate the weights.
U.S. bonds also carry currency exposure for a yen-based investor. Long-duration bonds can fall sharply when yields rise and are not substitutes for near-term spending cash. Keep near-term expenses in yen cash or suitable short-term safe assets, and allocate equities and bonds within the longer-term investment sleeve. Do not let payment dates dictate the wrong risks.
Use this board to compare dividend stocks with the market
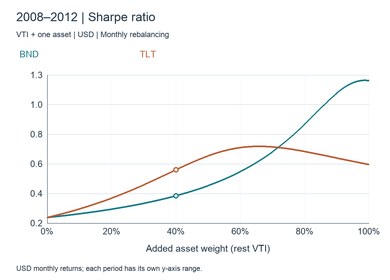
Place VYM, SCHD, VTI or ACWI and USD/JPY together. You can see whether dividend stocks keep pace with the wider market and how currencies affect a yen investor. Dividend stocks may lag a growth-led rally or lead when sector and interest-rate conditions change. Add BND or TLT to observe the relationship between bonds and stocks.
Daily charts show prices. An ex-distribution price decline is not automatically a loss of total wealth; use distribution-reinvested total returns for long-run performance. Japanese mutual funds publish a once-daily NAV, so their returns should not be treated as synchronous with an underlying U.S. ETF’s intraday quote.
The key to monthly income is not the largest advertised payout. It is a low-cost investment mix, a workable annual cash budget and deliberate geographical exposure. Start by considering design 2 plus a spending-cash account; choose design 1 for closer payment matching, design 3 for a Japan tilt or design 4 for U.S. dividend emphasis. Review distributions, reported expenses and actual regional exposure annually. That keeps the pleasure of receiving cash connected to the larger job of managing wealth.
Data and references
- FSA: Financial Report 2017
- FSA: Investment product sales review, 2018
- FSA: Access FSA No. 216 (2021)
- SBI Japan High Dividend: fund terms
- SBI Global High Dividend: launch and investment approach
- SBI Global High Dividend: quarterly settlement calendar
- SBI European High Dividend: fund information
- Rakuten VYM quarterly: product information
- Rakuten VYM: ETF fee reduction
- Rakuten SCHD: management-cost reduction
- Rakuten VYM: distribution history
- Rakuten SCHD: distribution history
- MUFG: eMAXIS distribution policy
- Monex: eMAXIS distribution class and management fee