“Buy when everyone is afraid” sounds sensible. Does it help an investor who saves each trading day? We compare daily S&P 500 purchases with accumulating cash until the VIX gives a signal, then investing all the available cash.
Across 8,288 trading days in 1993–2025, none of the tested zero-interest cash rules produced a clear long-run advantage over daily investing. Waiting for VIX 30 delivered final wealth of 82.54 when daily investing is 100. The answer changes with the period and cash yield: a level of 75 scored 121.97 in 2000–2009, while interest-bearing cash made level 76 the full-period maximum at 102.28. What happens while waiting matters as much as the signal.
What the VIX measures—and why a high reading is not a bottom
Under the Cboe methodology, VIX uses S&P 500 option prices to express expected volatility over the next 30 days at an annualized rate. It is forward-looking implied volatility, rather than simply the standard deviation of past stock returns. It does not directly measure market direction or the probability that stocks have reached a bottom.
Demand for downside protection can push option prices and VIX higher during anxious markets, hence the “fear gauge” nickname. A high reading can coexist with further declines. A low reading does not guarantee continued gains. A measure of uncertainty is useful context, but turning it into a purchase rule is a separate empirical question.
Introduced in 1993, redesigned in 2003
Cboe’s historical account and data describe the original 1993 index as based on S&P 100 options. The 2003 redesign moved to S&P 500 options across a wider range of strikes; the old approach is distinguished as VXO.
The current-method history extends back to 1990, but observations before the redesign were calculated retrospectively. Investors in the 1990s could not simply observe today’s version of VIX in real time. We retain that history for a long comparison and separately examine the 2010s and 2020s, after the current method was introduced.
Equal contributions, different purchase dates
The investment is SPY, an ETF tracking the S&P 500. Dividend- and split-adjusted prices approximate a reinvested investment rather than a price-only index. From January 29, 1993 through December 31, 2025, every strategy starts with no assets and receives $1 at each trading-day open. Fractional units are allowed; scaling contributions leaves the wealth ratios unchanged.
- Daily investing: buy SPY with each $1 contribution at that day’s open.
- VIX timing: save contributions in cash. On each qualifying day, buy SPY at the open with all accumulated cash, including the new contribution. Never sell the purchased shares.
Only the latest VIX close available before the SPY opening date can trigger a purchase. Execution is at the next available SPY open, without using that day’s future close or low. Consecutive qualifying days buy consecutive new contributions: this is an “at or above” rule, not a one-time threshold-crossing rule.
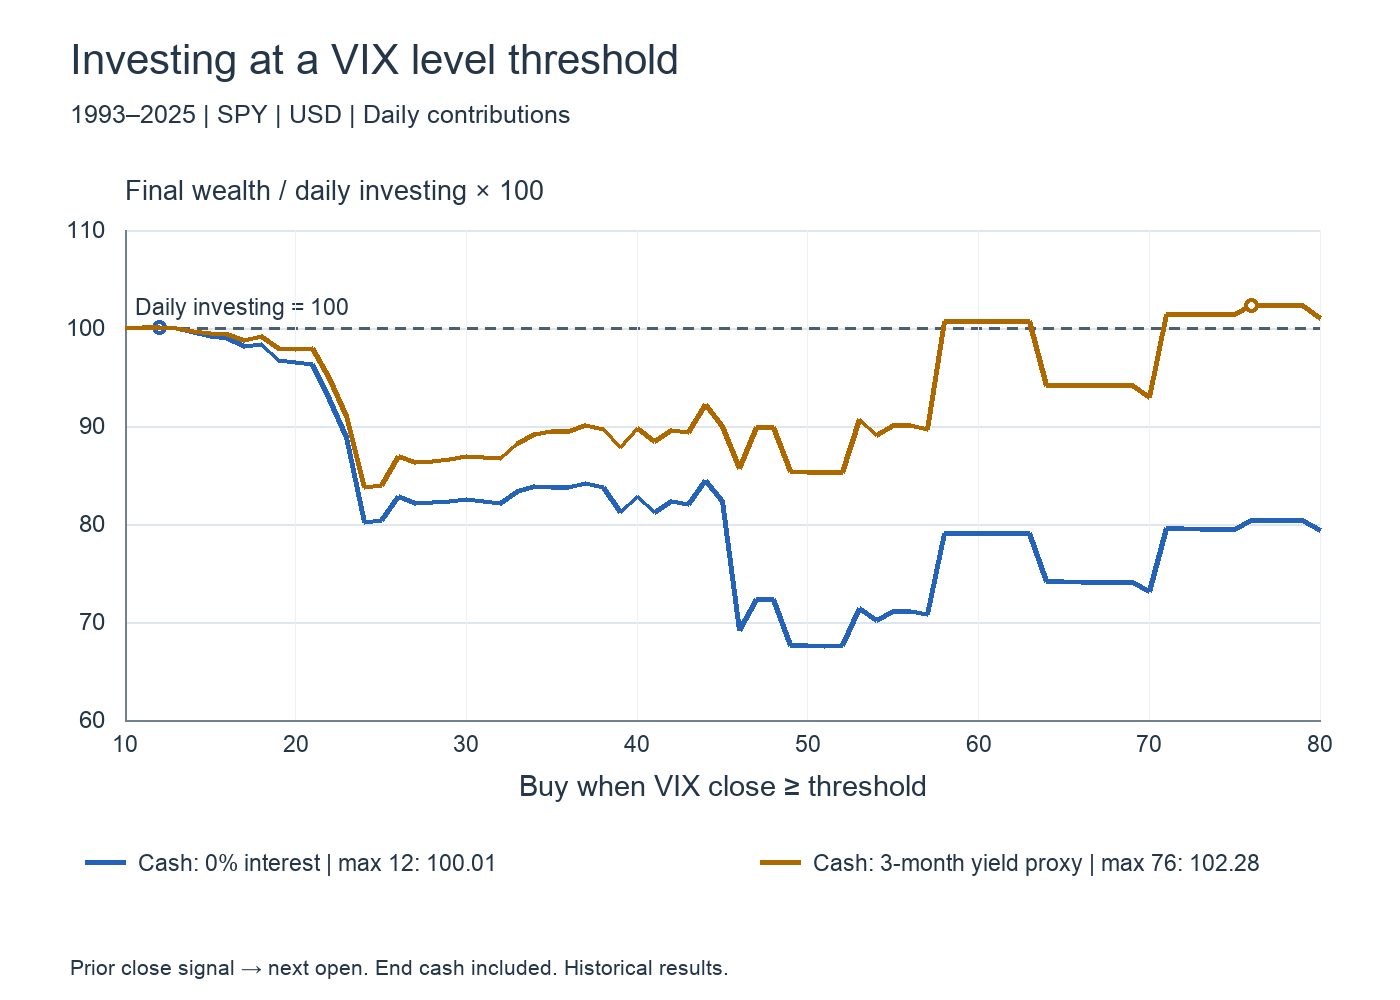
The vertical axis is ending SPY value plus uninvested cash, divided by the daily-investing result and multiplied by 100. A score of 110 means 10% more ending wealth; it is not an annual return. Cash left at the end counts toward wealth and is not forced into shares.
Rule 1: buy above a VIX level
We test levels 10–80 in increments of one. With no cash interest, the full-period maximum is 12 / 100.01, only about 0.01% above daily investing. A relatively low trigger allows frequent participation; waiting for extreme fear did not improve the long-run result.
Levels 20, 30 and 40 score 96.46, 82.54 and 82.83. Level 30 purchases on 703 of 8,288 trading days, with a longest waiting interval of 1,733 calendar days. Concentrating purchases in cheaper markets helps, but missing the advance before those opportunities hurts. Over the full sample, the latter effect dominates.
Rule 2: buy after a one-day VIX jump
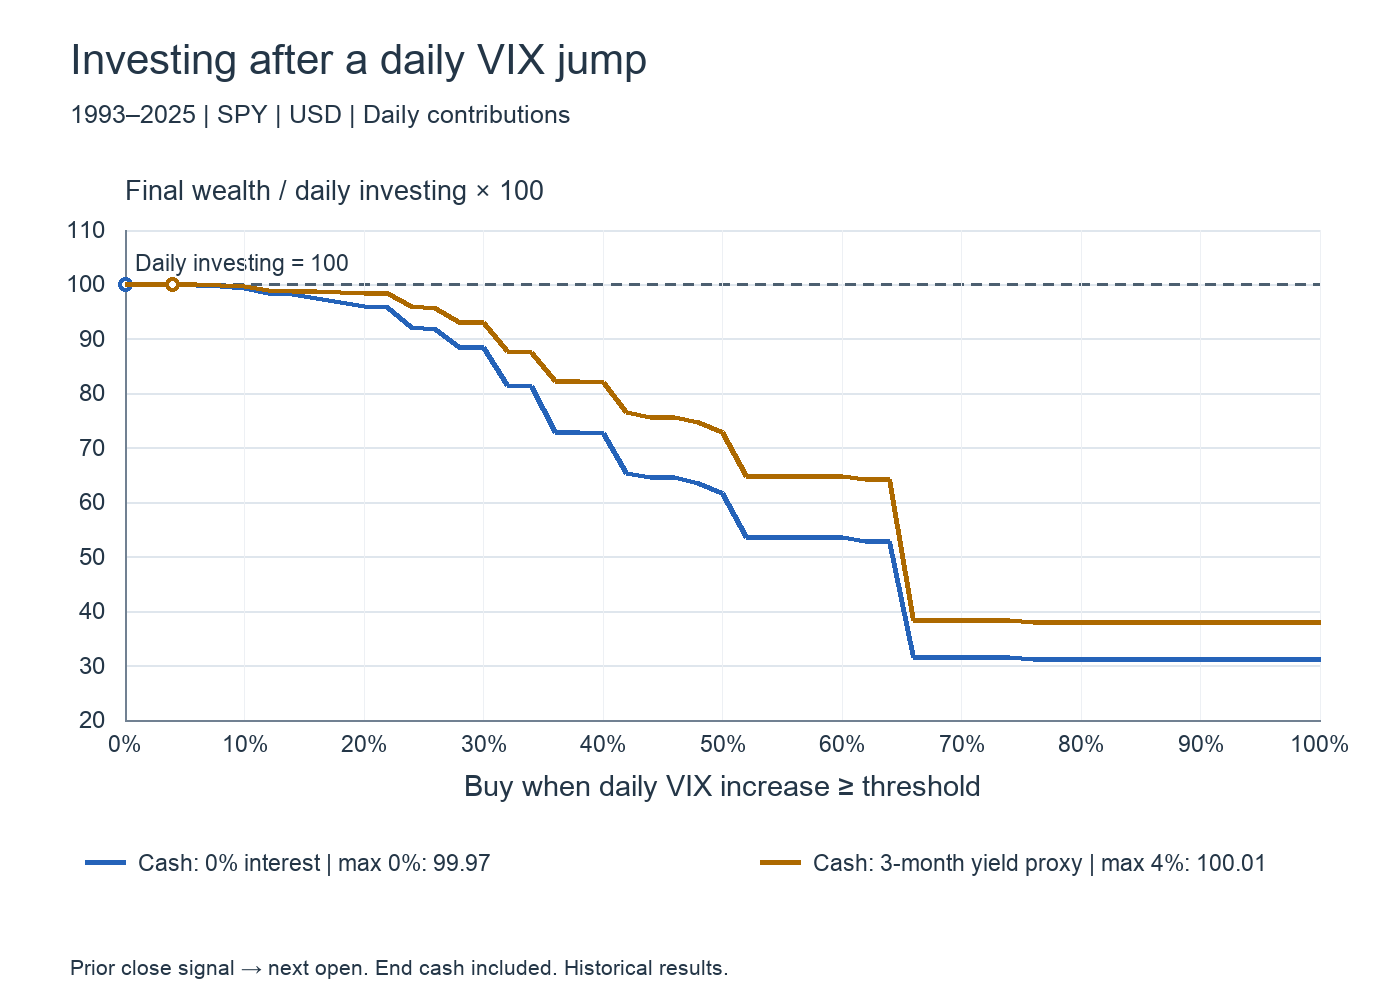
The signal is the percentage increase between the latest two observed VIX closes. Moving from 20 to 24 is +20%, not a 20-point increase. Thresholds run from 0% to 100% in two-percentage-point increments.
With zero cash interest, +10% scores 99.34, +20% scores 95.90 and +50% scores 61.67. Even the grid maximum, at 0%, is only 99.97. The +50% condition buys on just eight days across the entire sample. A more dramatic signal creates a longer wait; recognizing panic does not establish that suspending regular purchases improves returns.
Rule 3: buy after a five-observation increase
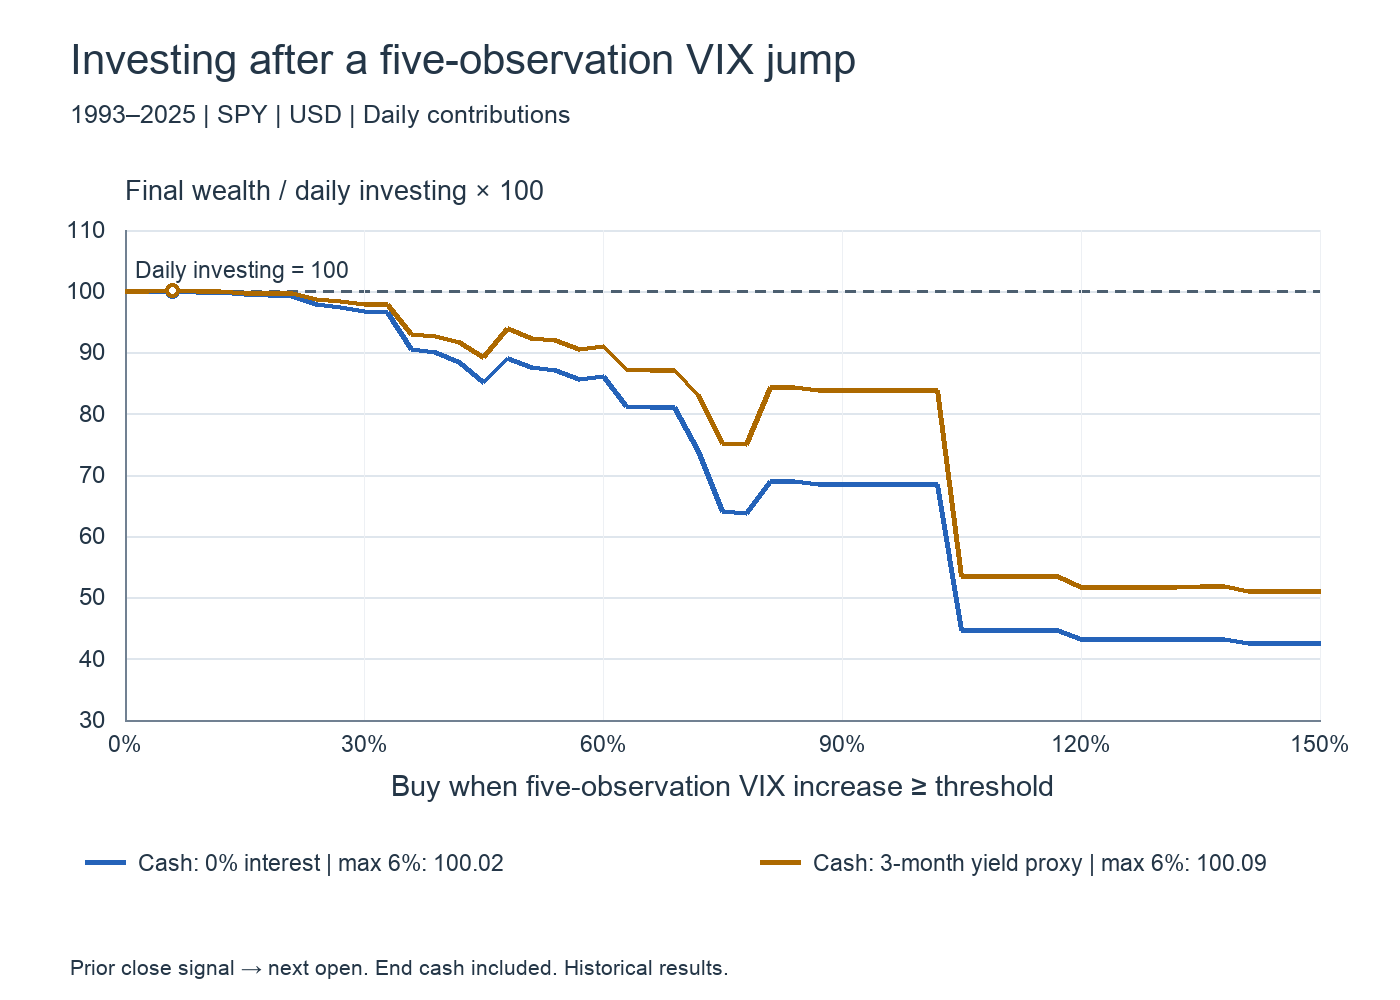
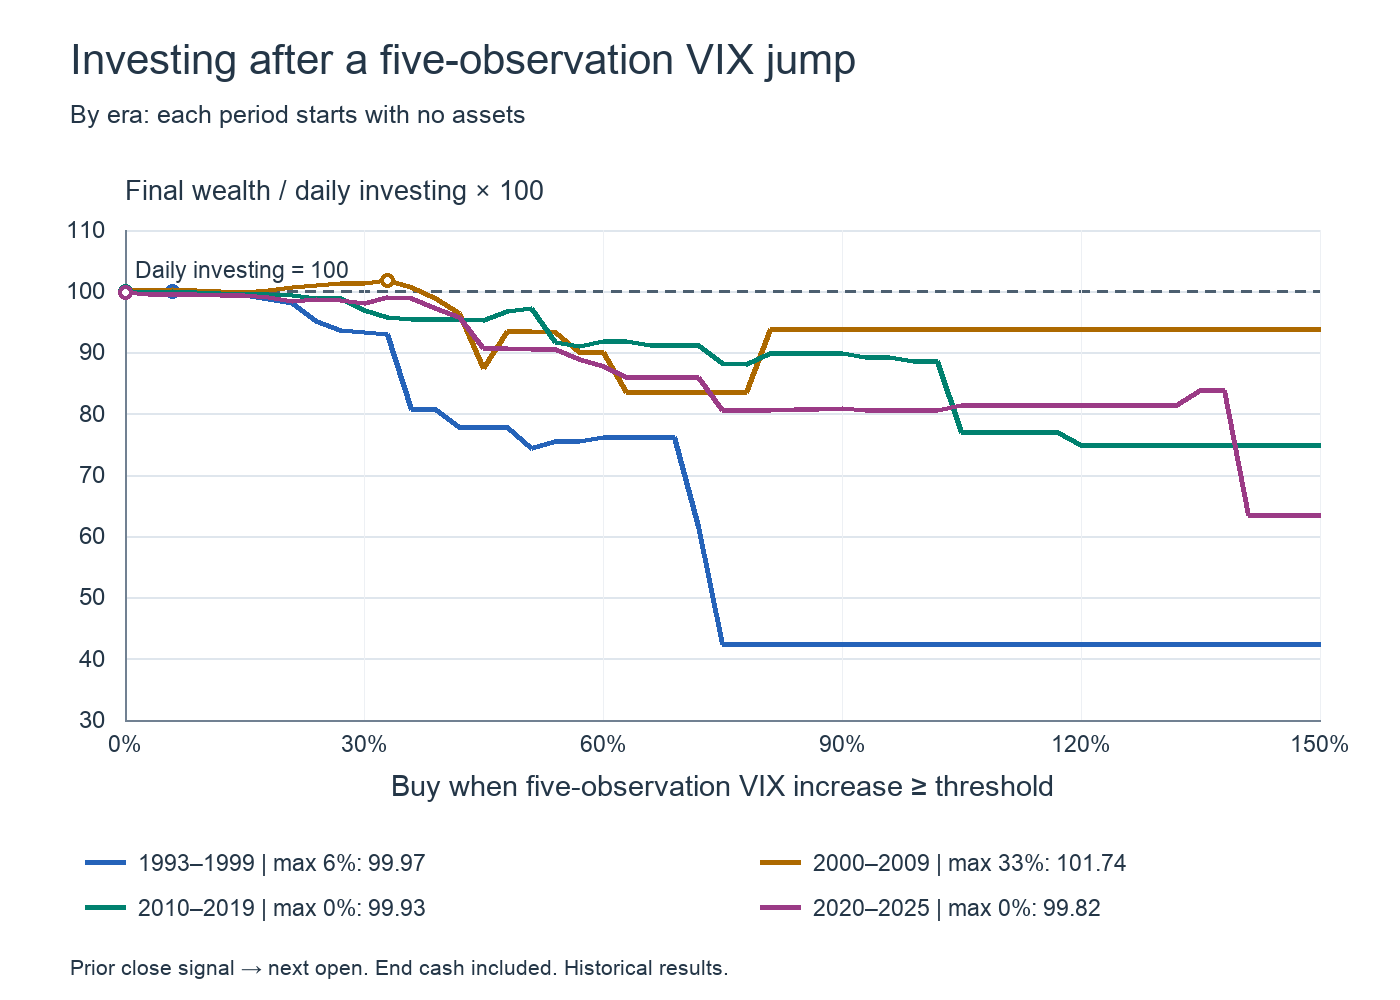
A change over five VIX observations can capture anxiety that builds over several sessions. We test 0–150% in three-percentage-point steps. The zero-interest full-period maximum is +6% / 100.02. At +30%, +50% and +75%, scores are 96.77, 89.09 and 64.04.
Spreading the measurement window does not remove the cost of staying out. The +75% rule buys on only 30 days and has a longest waiting interval of 5,143 calendar days.
| Buy rule | Cash 0% | Cash yield proxy | Purchase days | Longest gap (days) |
|---|---|---|---|---|
| VIX level ≥ 20 | 96.46 | 97.80 | 3,149 | 811 |
| VIX level ≥ 30 | 82.54 | 86.92 | 703 | 1,733 |
| VIX level ≥ 40 | 82.83 | 89.74 | 208 | 2,182 |
| VIX level ≥ 60 | 78.98 | 100.62 | 38 | 5,733 |
| One-observation increase ≥ 10% | 99.34 | 99.62 | 563 | 201 |
| One-observation increase ≥ 20% | 95.90 | 98.38 | 121 | 1,117 |
| One-observation increase ≥ 50% | 61.67 | 72.83 | 8 | 5,143 |
| Five-observation increase ≥ 30% | 96.77 | 97.90 | 275 | 540 |
| Five-observation increase ≥ 50% | 89.09 | 93.95 | 81 | 1,989 |
| Five-observation increase ≥ 75% | 64.04 | 75.20 | 30 | 5,143 |
Cash interest can change the ranking
For a saving-and-waiting strategy, cash yield is consequential. A sensitivity case uses FRED’s three-month Treasury constant-maturity yield as an annual interest proxy. This is not the realized return of a deposit or Treasury product; taxes and fees are not deducted.
The full-period level maximum moves to VIX 76 / 102.28. Levels 60 and 80 score 100.62 and 100.93, while 30 and 40 still trail at 86.92 and 89.74. For percentage-change rules, the best scores are +4% / 100.01 over one observation and +6% / 100.09 over five. Interest does not make every fear signal profitable.
An extreme level such as 76 combines years of interest income with rare purchase opportunities. Selecting that peak after seeing the sample is not evidence that waiting for 76 will work tomorrow. Nor can a yen savings account be assumed to earn the historical dollar Treasury yield.
The best threshold shifts between eras
| Period | VIX level | Daily increase | Five-observation increase |
|---|---|---|---|
| 1993–2025 | 12 / 100.01 | 0% / 99.97 | 6% / 100.02 |
| 1993–1999 | 12 / 100.02 | 0% / 99.95 | 6% / 99.97 |
| 2000–2009 | 75 / 121.97 | 20% / 101.85 | 33% / 101.74 |
| 2010–2019 | 20 / 100.08 | 6% / 99.98 | 0% / 99.93 |
| 2020–2025 | 19 / 100.18 | 0% / 99.96 | 0% / 99.82 |
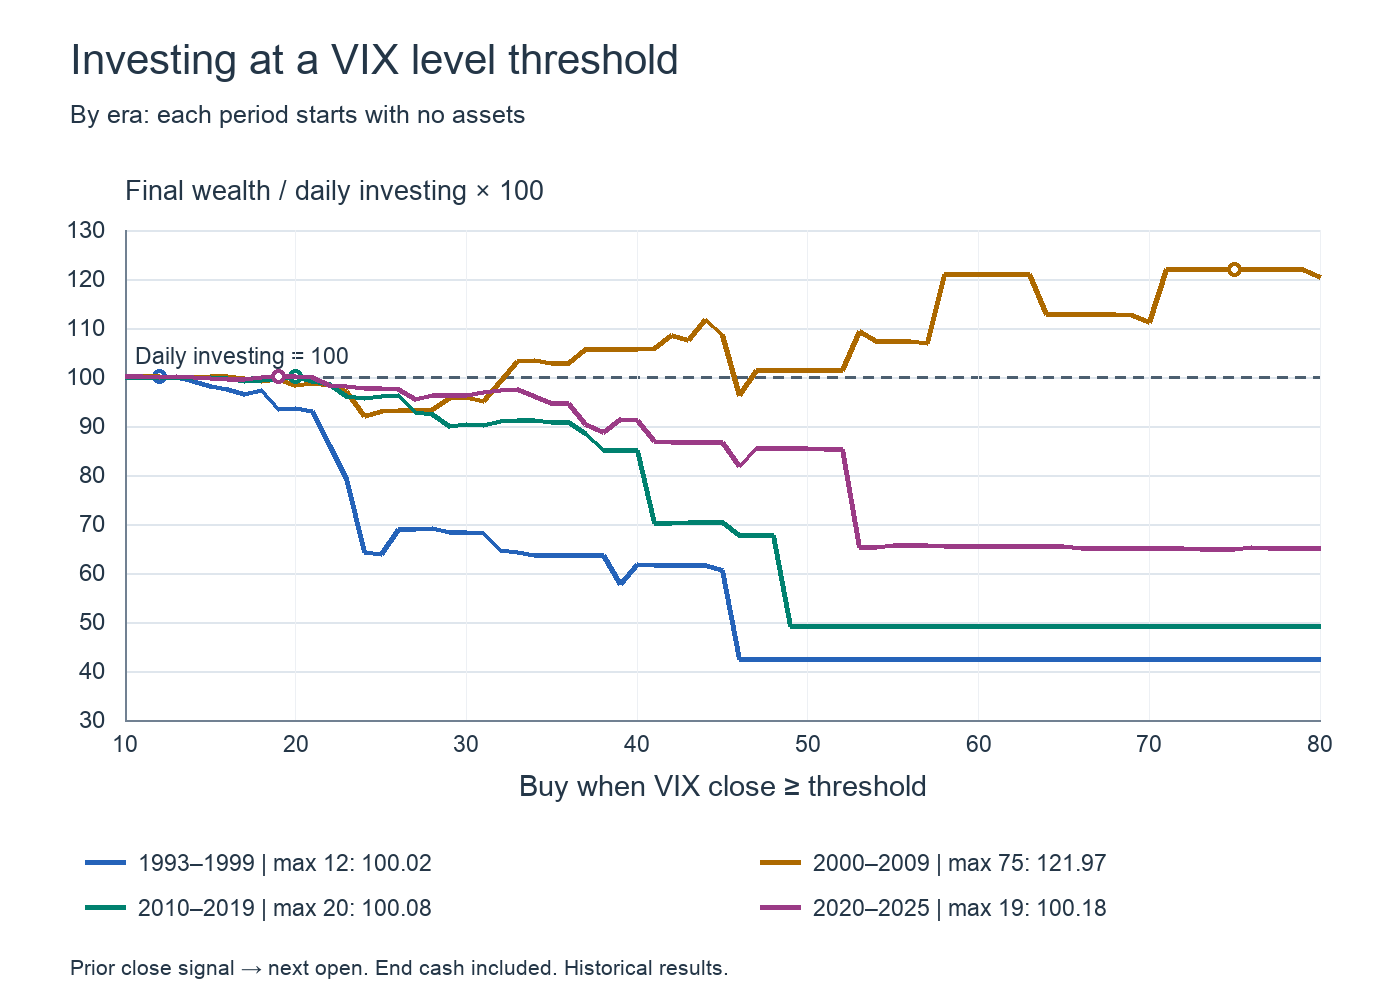
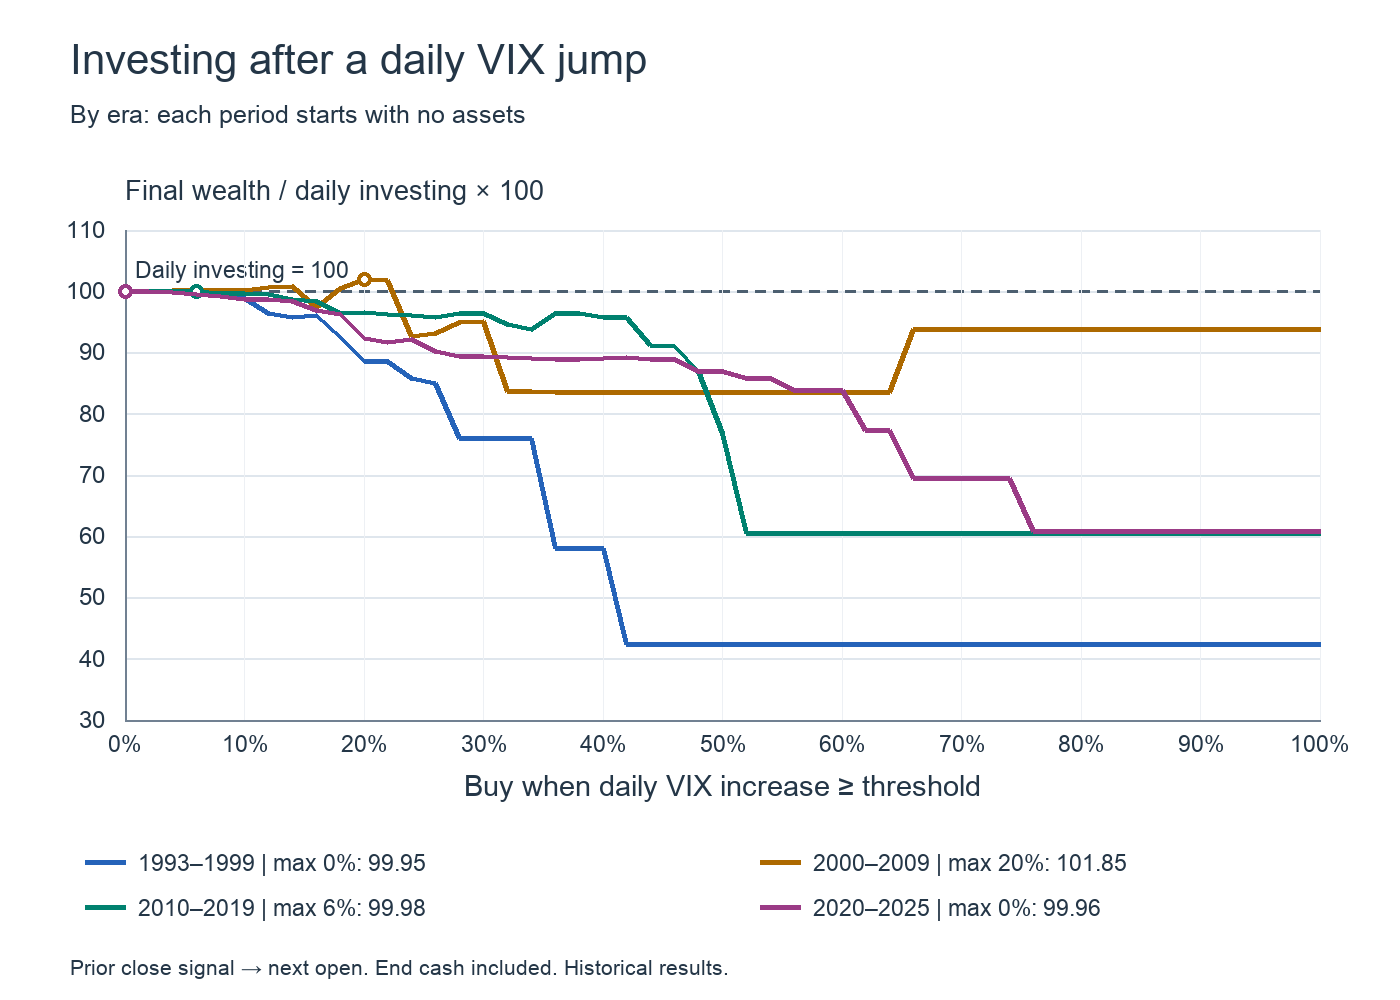
The standout is level 75 in 2000–2009, scoring 121.97. That period contains two major equity declines, and some rules benefited from accumulating cash before investing during crisis-level VIX readings. The daily +20% and five-observation +33% rules also outperform slightly, at 101.85 and 101.74.
The best levels elsewhere are 12 for 1993–1999, 20 for 2010–2019 and 19 for 2020–2025. The latter two maxima are only 100.08 and 100.18. Conditions that reward continuous participation differ from conditions that reward concentrating savings late in a prolonged decline.
Each era resets assets to zero and normalizes its own daily-investing result to 100. These are separate contribution experiments, not slices of the same portfolio. The 2000s score of 121.97 cannot be read as a persistent advantage across the full 33-year period.
Choose early, then freeze the threshold
| Signal | Frozen threshold | 1993–2009 selection | 2010–2025 evaluation |
|---|---|---|---|
| VIX level | 12 | 100.03 | 99.95 |
| One-observation increase | 4% | 99.99 | 99.89 |
| Five-observation increase | 6% | 100.08 | 99.83 |
We select the best zero-interest threshold using only 1993–2009, then apply it unchanged to 2010–2025. Level 12 scores 99.95, daily +4% scores 99.89 and five-observation +6% scores 99.83. All three fall short of daily investing in the later period.
This is a chronological holdout, not a completely untouched forecasting exercise: the rules were designed today with historical knowledge, and early current-method VIX is partly retrospective. It nevertheless shows whether an early-period choice travels to later data. Searching 71, 51 and 51 thresholds also invites favorable coincidences. A score of 100.01 is not compelling evidence of a durable edge.
Use the board to understand fear and price reactions
Put VIX beside the S&P 500, especially during weak markets. Observe how far equities fall when VIX rises, whether they rebound the following session and whether renewed selling follows. Compare the speed of declining fear with the speed of the equity recovery. This helps challenge the assumption that the most frightening day must be the bottom.
Daily observation can make volatility more familiar without requiring more trades. Keep the habit of watching separate from the decision to suspend contributions. Under these conditions, continued participation provides the stronger long-run foundation. If you build a VIX purchase rule, examine cash yield, the longest wait and performance in another era before choosing the threshold.
Data and calculation details
Data were retrieved and calculated on October 7, 2026, with the sample ending in 2025. VIX daily closes come from Cboe; SPY daily history comes from Yahoo Finance. Adjusted closes approximate dividend reinvestment. Each raw open is multiplied by that day’s adjusted-close/raw-close ratio so purchase units and ending values use the same adjustment basis. Fund expenses embedded in prices remain reflected; trading fees, spreads, investor taxes and exact dividend-payment timing are not modeled.
Signals always use the latest observed VIX close strictly before the SPY opening date. Three SPY dates lack a same-date VIX row in the retrieved Cboe file: January 31, 1997, November 26, 1997 and December 31, 1999. Subsequent decisions retain the latest available close, without inventing values or interpolating with future data. The one- and five-observation changes use valid VIX observations, not necessarily one and five calendar days.
For cash interest, the latest yield observed by the preceding calendar day compounds existing cash by (1 + annual yield)^(elapsed calendar days / 365), before the new contribution is deposited. Contributions and results are nominal dollars; yen exchange rates and Japanese inflation are excluded. A yen-denominated fund investor would obtain different results.
This is a historical backtest using the observed sequence, not a Monte Carlo estimate of future success probabilities. Final wealth does not score every risk or the value of liquidity: cash-heavy strategies may reduce interim equity exposure, which these charts do not reward separately. We test when to invest new contributions, not VIX-triggered selling or the investment of an initial lump sum.
Data and references
- Cboe — VIX history and daily data
- Cboe — VIX methodology
- State Street — SPY
- Yahoo Finance — SPY historical prices
- FRED — three-month Treasury constant-maturity yield