“Buy low, sell high,” buying when others are frightened, and treating bear markets as buying opportunities all express a contrarian instinct. Warren Buffett’s 2004 shareholder letter discusses acting against fear and greed. Howard Marks argues that, other things equal, falling prices should make ownership more attractive. These ideas concern buying valuable assets amid pessimism—not a guarantee that every falling price is a bargain.
Index investors also emphasize time in the market rather than timing it. Vanguard explains the cost of waiting outside the market. For someone receiving a paycheck every month, the practical question is whether waiting for a cheaper entry justifies giving up investment time.
Compare identical paychecks, not perfect hindsight
We compare investing fresh monthly income immediately with saving it until a decline triggers a purchase. Neither strategy sells shares already purchased. This is not a simulation of selling everything before a crash or choosing the eventual bottom after seeing it.
My conclusion is to use immediate monthly investing as the foundation. Dip buying can dominate in a particular market era. The same rule can then spend years waiting while prices rise. The fair test includes the time spent out of stocks and any cash still uninvested at the end.
Three rules, the same $1,000 each month
Using SPY to represent dividend-reinvested S&P 500 exposure, the full sample runs from April 1, 1993 through December 31, 2025. Each strategy receives $1,000 at the first trading-day open of every month. Immediate investing buys then. Dip strategies check the previous session’s adjusted close and buy at the next open with all waiting cash. They also buy new income when the condition remains satisfied. Shares are never sold.
- Weekly decline: 5-session falls of 0–10%, tested in 0.25-point steps.
- Monthly decline: 21-session falls of 0–20%, in 0.5-point steps—not calendar-month returns.
- Drawdown: 0–50% below the highest adjusted close observed to date, in 1-point steps. Previously observed peaks remain available when a new test period begins.
Waiting cash earns a three-month Treasury-yield interest proxy. Ending wealth includes remaining cash. Contributions total $393,000; immediate investing ends with $3,133,273. Every chart expresses ending wealth relative to immediate investing = 100. A score of 105 means 5% more final wealth, not a 5% annual return.
Short dips: cheaper entries versus lost time
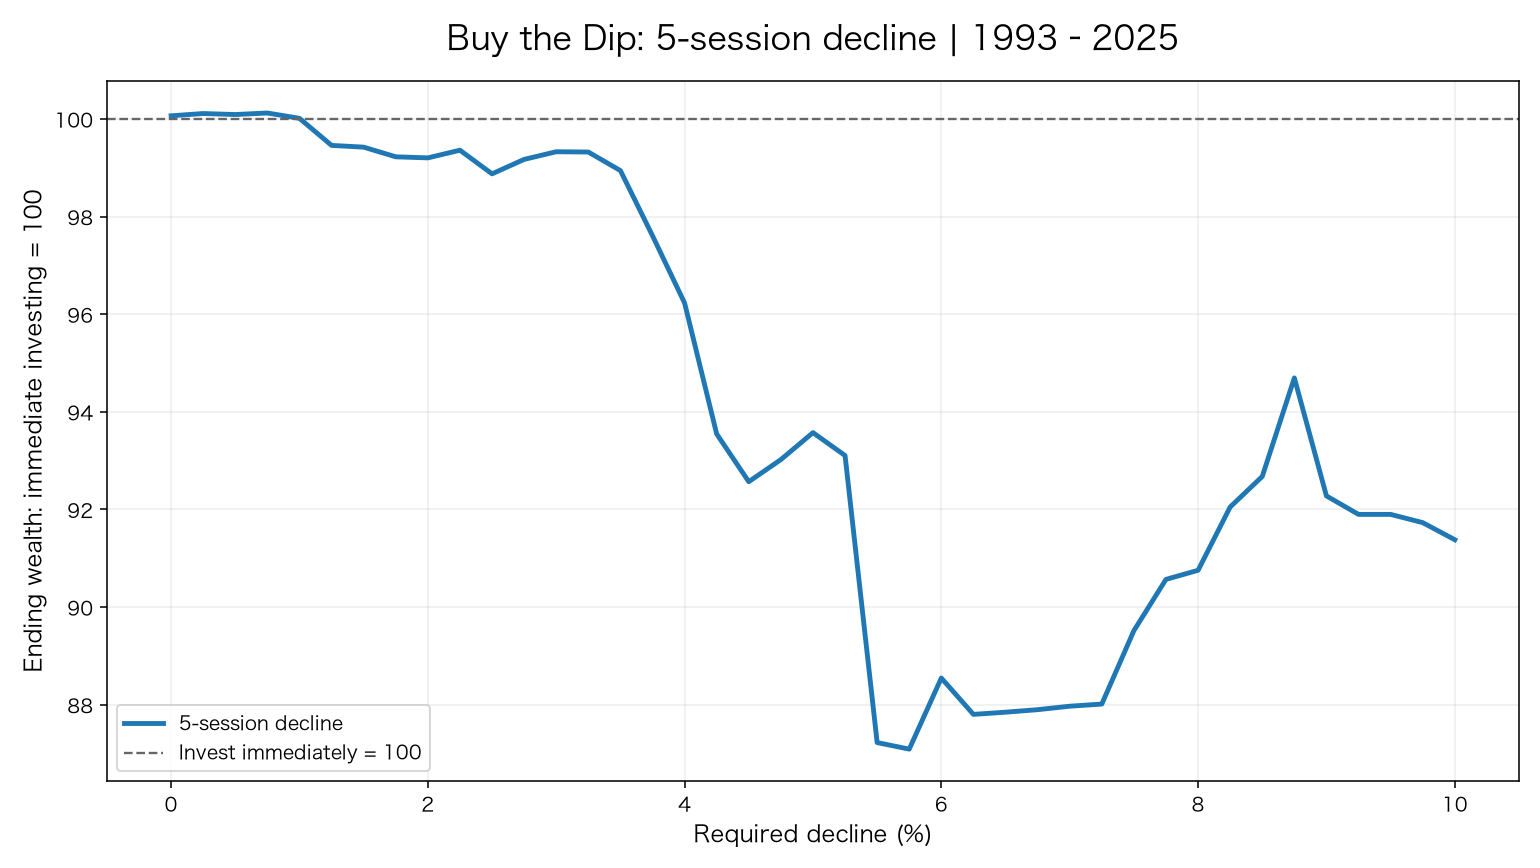
The best full-sample weekly threshold scores just 100.12. Waiting for a 2% five-session decline scores 99.20. Frequent small dips offer cheaper entries, but waiting through intervening advances offsets much of the benefit.
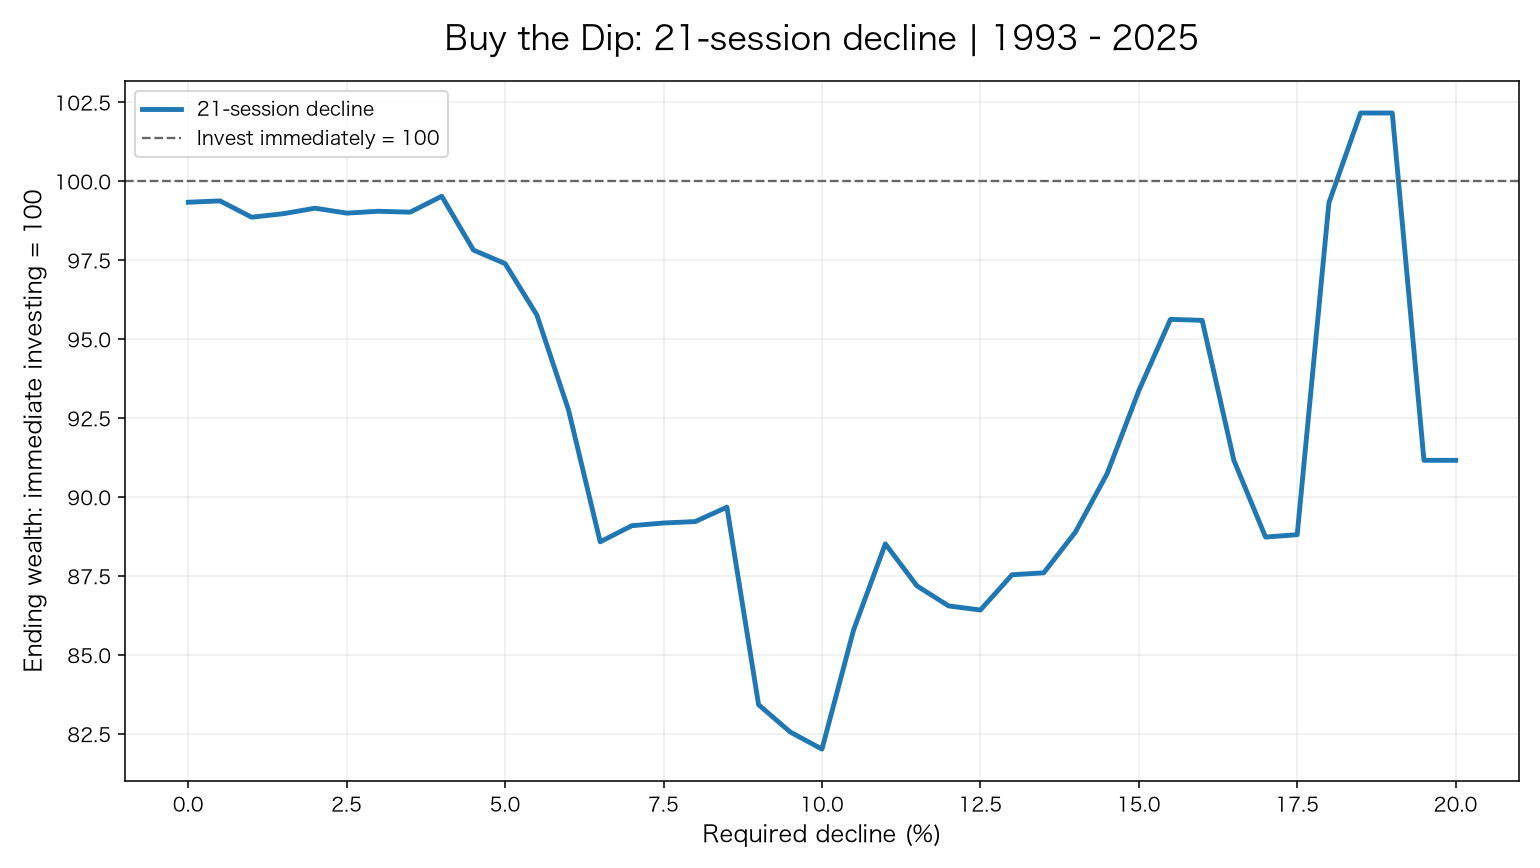
A 5% 21-session decline rule scores 97.38. The 18.5% rule reaches 102.15. Deeper triggers improve the potential entry price but reduce purchase opportunities. The curve therefore does not rise smoothly as the trigger deepens: which crashes are captured matters.
Waiting for a crash: a historical maximum is not a universal rule
| Rule | Immediate = 100 | Ending wealth | Ending cash | Purchase days |
|---|---|---|---|---|
| 5-session decline ≥ 2% | 99.20 | $3,108,345 | $0 | 254 |
| 21-session decline ≥ 5% | 97.38 | $3,051,248 | $8,119 | 112 |
| Drawdown from peak ≥ 10% | 91.02 | $2,851,961 | $8,119 | 156 |
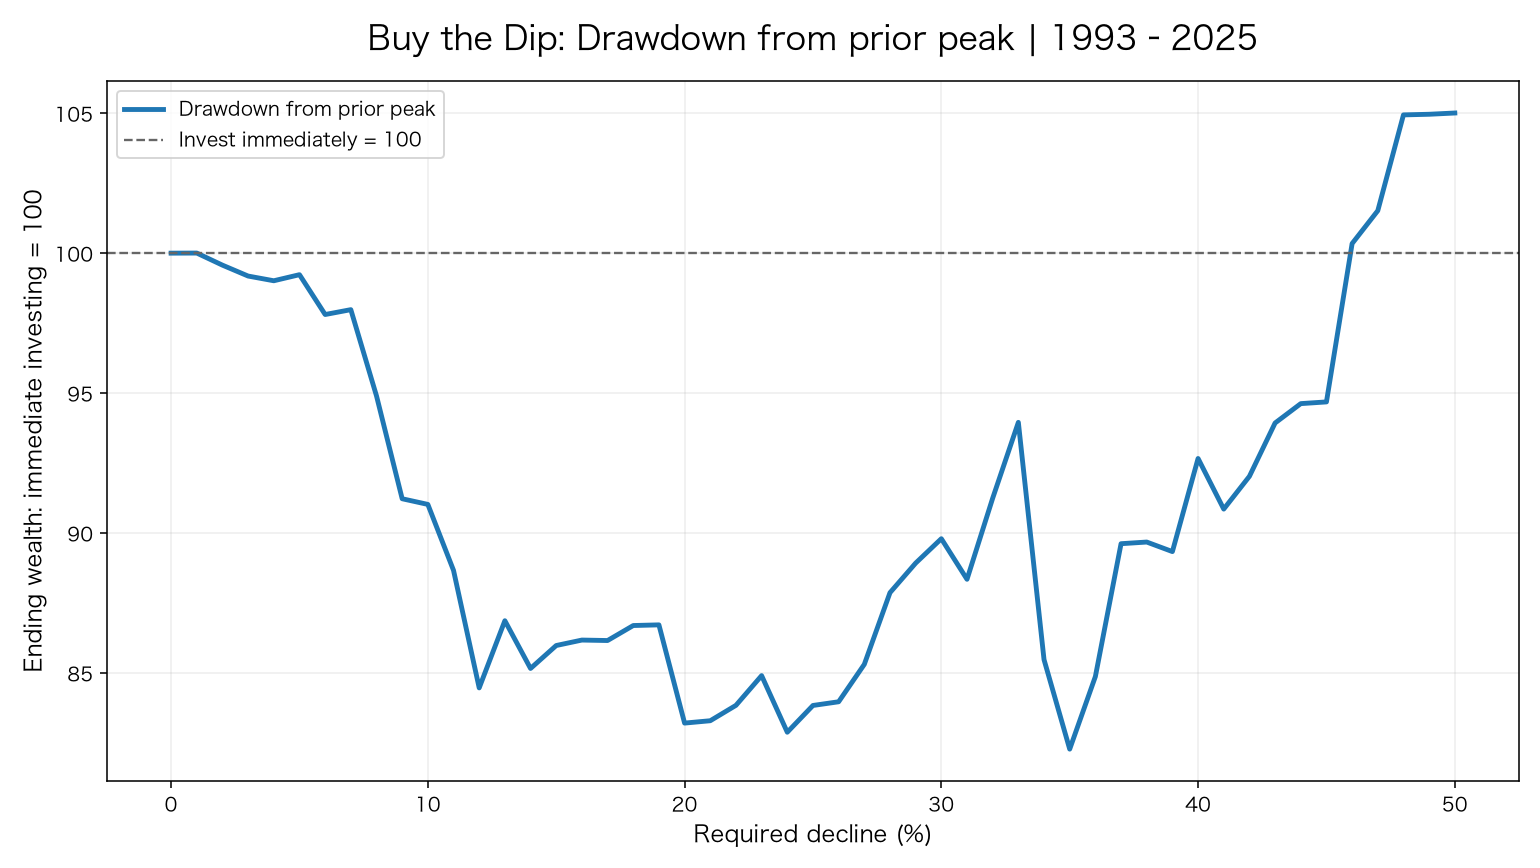
Waiting for a 10% drawdown scores 91.02. A 50% trigger scores 105.01, the highest result within the tested range. Because the maximum lies at the grid’s 50% boundary, this is a tested-range maximum, not proof of a universal optimal threshold. Capturing the 2008–2009 collapse strongly shapes the long-sample result.
A discount from the peak is not necessarily a discount from the price available when income arrived. A market rising from 100 to 120 and then falling 10% is still at 108. Someone who could have bought at 100 has not improved the entry simply by purchasing below a later peak. The relevant benchmark is investing without waiting.
Strong in the 2000s, costly in the 2010s
| Period | 10% drawdown rule | Best tested threshold | Best tested score |
|---|---|---|---|
| 1993–2025 | 91.02 | 50% | 105.01 |
| 1993–1999 | 82.21 | 0% | 100.00 |
| 2000–2009 | 101.20 | 50% | 153.49 |
| 2010–2019 | 92.03 | 0% | 100.00 |
| 2020–2025 | 97.23 | 17% | 101.43 |
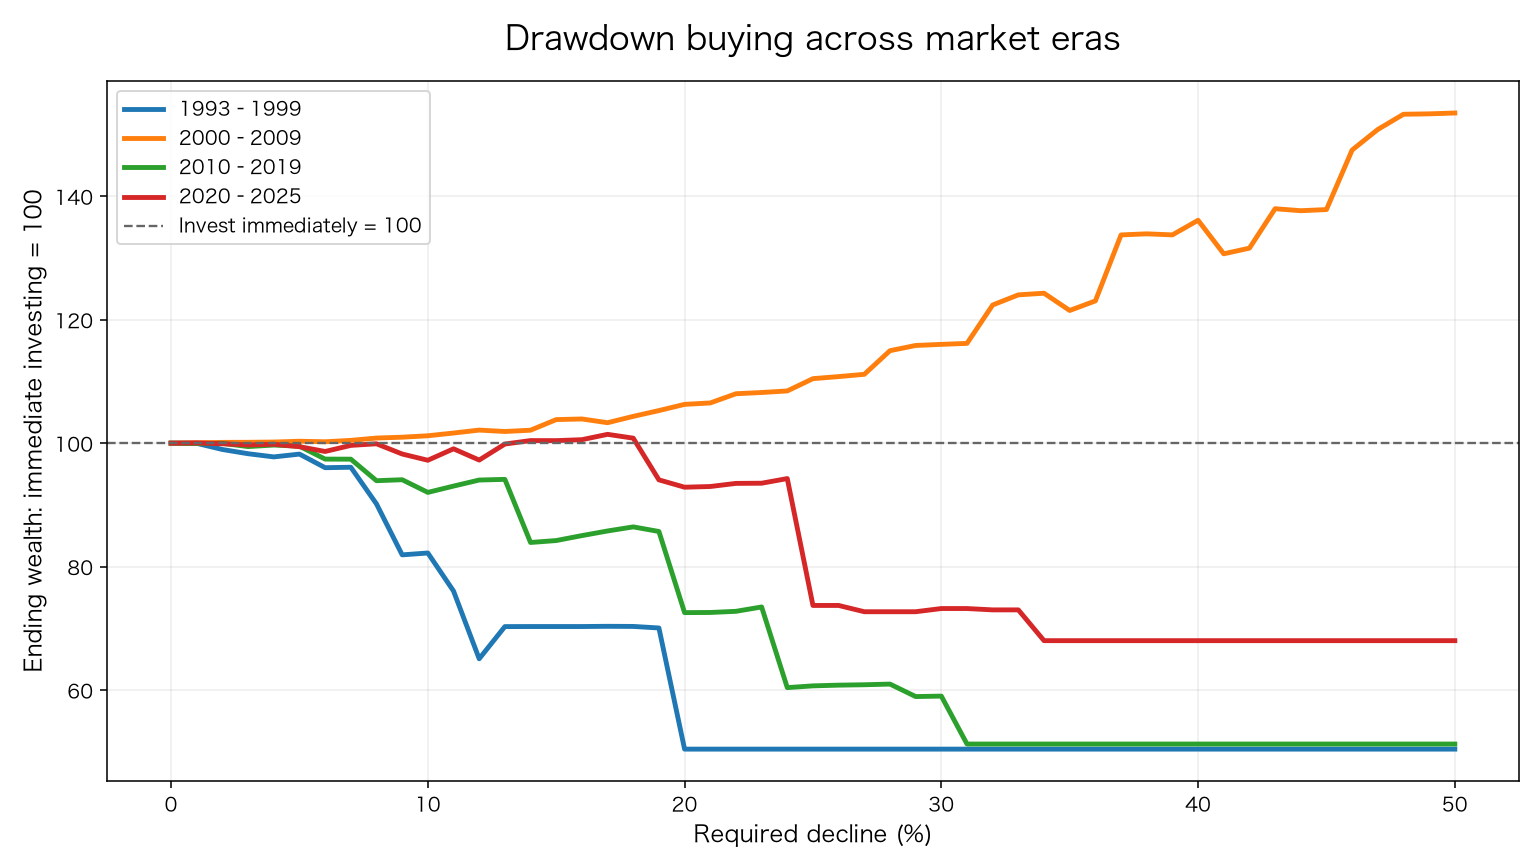
The 2000–2009 window contains the technology bust and financial crisis. A 50% drawdown trigger scores 153.49 there. In contrast, the best drawdown threshold during 2010–2019 is zero: do not hold back the paycheck. Long advances reward time invested more than waiting for deep discounts.
The ending date matters for contributions. Later paychecks have less time to compound and are especially sensitive to late-period declines or recoveries. A lump-sum return chart cannot answer the monthly-income timing question by itself.
Twenty-three starting years, ten years each
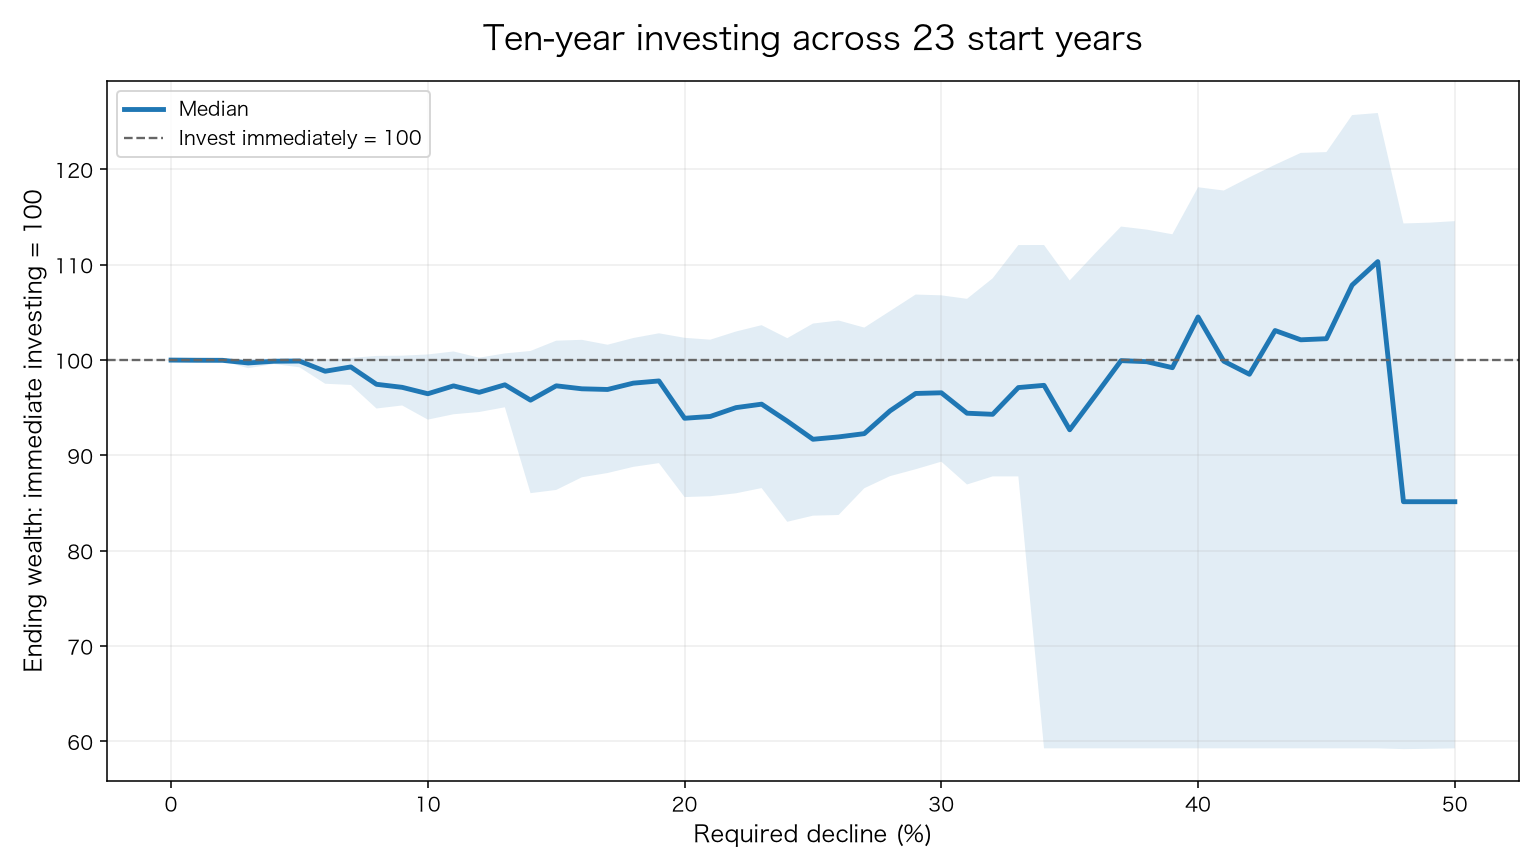
We also start ten-year monthly plans in each year from 1994 through 2016. The chart shows the median and middle 50% of the 23 outcomes. The 10% drawdown trigger has a median score of 96.47 and beats immediate investing in 30.4% of those windows. The windows overlap; they measure start-date sensitivity rather than 23 independent trials.
Choose the rule in the first era, keep it fixed in the next
| Rule | Chosen in 1993–2009 | Training score | 2010–2025 score |
|---|---|---|---|
| 5-session decline | 0.75% | 100.23 | 99.75 |
| 21-session decline | 18.5% | 114.54 | 64.75 |
| Drawdown from peak | 50% | 127.62 | 33.47 |
Choose each strategy’s best threshold using 1993–2009 only, then apply it unchanged to a fresh, zero-holdings simulation in 2010–2025. The 18.5% monthly trigger scores 64.75; the 50% drawdown trigger scores 33.47. A rule that successfully captured earlier crashes becomes a rule that holds cash through later gains. Even the selected 0.75% weekly rule scores only 99.75.
Selecting a visually impressive historical entry rule and sustaining an advantage in a different market are separate challenges. For an income-investment plan meant to run for years, robustness to changing markets is more useful than one spectacular backtest.
Cash interest helps, but does not erase time outside stocks
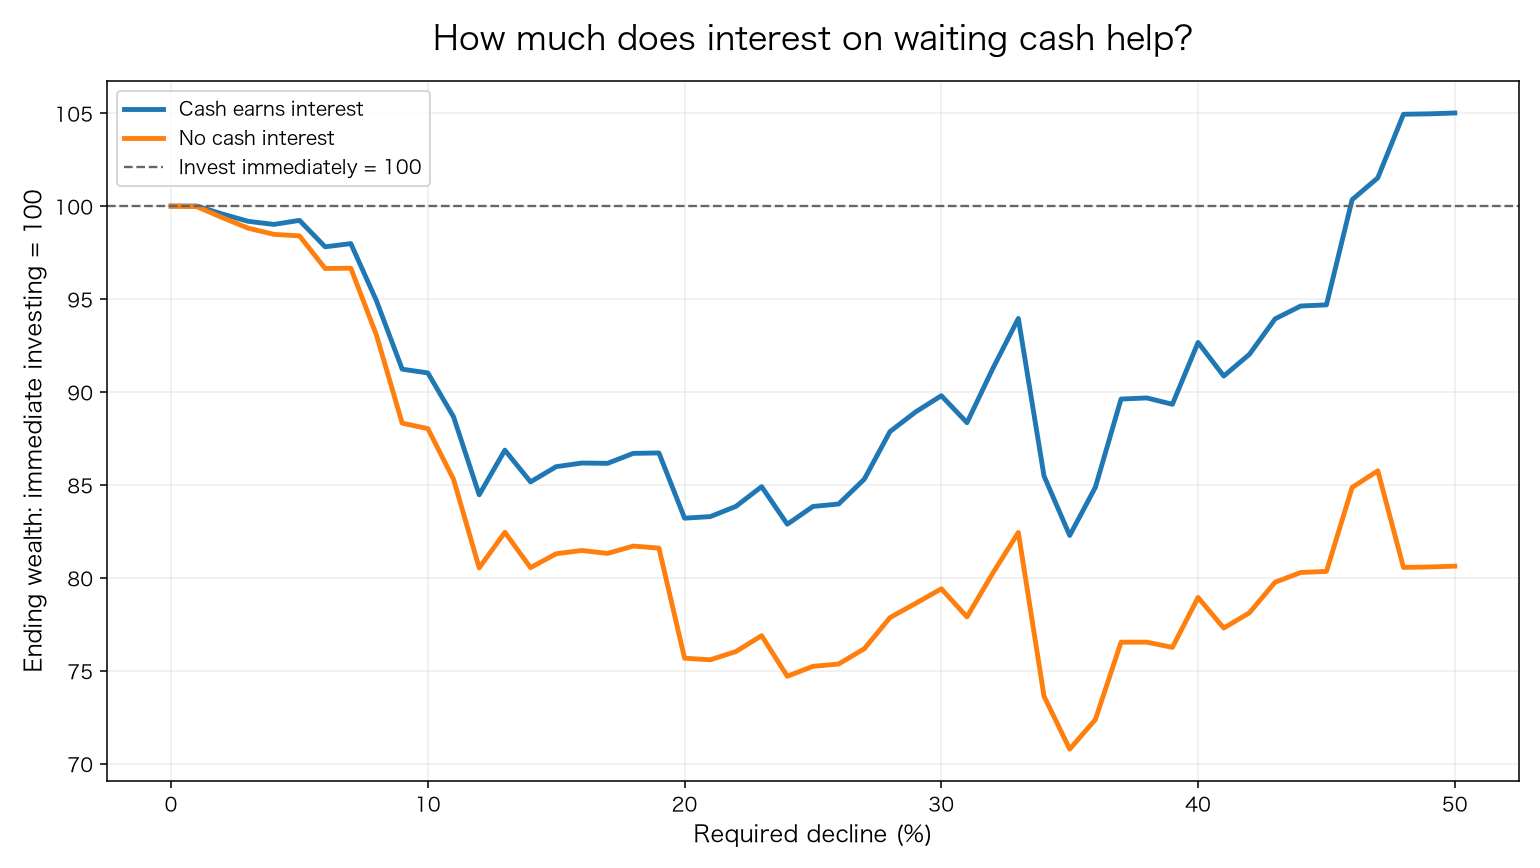
Compare zero-interest cash with the Treasury-yield proxy. Interest improves dip-buying outcomes, especially for rules that wait a long time. But interest and equity growth are different sources of return. Evaluate ending wealth after cash interest rather than assuming high rates automatically justify postponing investment.
Using this dashboard: observe declines without abandoning consistency
Place the S&P 500, Nasdaq 100, Nikkei and global equities together to distinguish a growth-stock decline from broader selling. Add Treasury yields to observe whether higher rates coincide with weaker stocks. Intraday red charts do not reproduce the study’s 5-session, 21-session or historical-peak signals; the dashboard’s daily change measures a different interval.
Use the board to understand the market, not to find a new reason to stop investing every day. Consistency protects time invested. Extra purchases can use spare funds kept separate from living expenses without dismantling the monthly plan. My choice from this analysis is to invest when income arrives and preserve that habit on falling days.
Data and accounting
Calculations were run October 11, 2026 using validated data retrieved October 7 and ending in 2025. SPY adjusted closes from Yahoo Finance reflect splits and approximate dividend reinvestment. Raw opens are multiplied by each day’s adjusted-close/raw-close ratio. This is reinvested ETF exposure, not the price-only S&P 500 index.
Cash interest uses FRED DGS3MO, the latest observation available through the prior calendar date, applying (1 + annual yield)^(calendar days / 365) to existing cash between trading sessions. It is an interest comparison model, not the realized return of a deposit account or bond ETF. Each window starts without assets, receives equal monthly contributions, allows fractional units and includes ending cash. Taxes, currency movements, commissions and spreads are excluded; costs already reflected in SPY prices are not deducted twice.
Zero weekly or monthly thresholds still require a nonpositive trailing return; they are not identical to immediate monthly investing. A zero drawdown threshold qualifies every day and therefore matches immediate investing. Historical maxima are chosen only within the tested grids.
Data and references
- Yahoo Finance — SPY historical prices
- FRED — DGS3MO
- State Street — SPY
- Berkshire Hathaway — 2004 shareholder letter
- Oaktree — What Does the Market Know?
- Vanguard — Counting the cost of timing the market