How much gold belongs beside equities: 10%, 20%, or half? Rules of thumb do not tell us which mix reduces volatility or delivers the most return per unit of risk. We tested the valley of portfolio risk and the peak of the Sharpe ratio using ten years of monthly returns, pairing gold with the S&P 500, ACWI and TOPIX.
For January 2016 through December 2025, measured in US dollars, the minimum-volatility gold weight was 46.5–53.3%. The maximum-Sharpe weight was 53.0–66.3%. Gold rose strongly over this decade. The efficient historical mix treated it as a substantial return source alongside equities, rather than just a small insurance position.
Match the currency, distributions and 120 monthly observations
We used adjusted ETF prices: SPY for the S&P 500, ACWI for global stocks and 1306 for TOPIX. These are ETF-based proxies reflecting reinvested distributions and split adjustments, not the raw price indexes. Gold is represented by physically backed SPDR Gold Shares, GLD. Its expenses affect its returns, which differ from physical bullion or futures.
The primary study is in USD. We divided yen-denominated 1306 by monthly USD/JPY and calculated returns from each market’s last observation of the month. Target weights are restored every month. Taxes, trading commissions and rebalancing costs are excluded; fund-level expenses remain reflected in prices.
Low correlation does not mean opposite moves every month
Correlation is calculated between monthly returns, not price levels. A value near +1 indicates strong same-direction co-movement, −1 opposite co-movement, and zero little linear association. Gold’s correlation was +0.086 with the S&P 500, +0.155 with ACWI and +0.088 with USD-converted TOPIX: all modestly positive.
| Equity proxy | Correlation with gold | Equity volatility | Equity Sharpe |
|---|---|---|---|
| S&P 500 | +0.086 | 15.08% | 0.85 |
| ACWI | +0.155 | 14.39% | 0.71 |
| TOPIX | +0.088 | 13.32% | 0.48 |
The return signs were opposite in 53 of 120 months for the S&P 500 and gold, 51 for ACWI and 58 for TOPIX. One asset did not rescue the other every month. Diversification also comes from different-sized gains when both rise, and different-sized losses when both fall. Those differences reduce the variation of their weighted sum.
The volatility curve has a clear valley
Risk here is the sample standard deviation of monthly returns multiplied by √12. It measures annualized volatility, not maximum loss or the probability of losing money. The left edge is 100% equities; the right edge is 100% gold. Each curve falls as gold is added, reaches a valley and then rises.
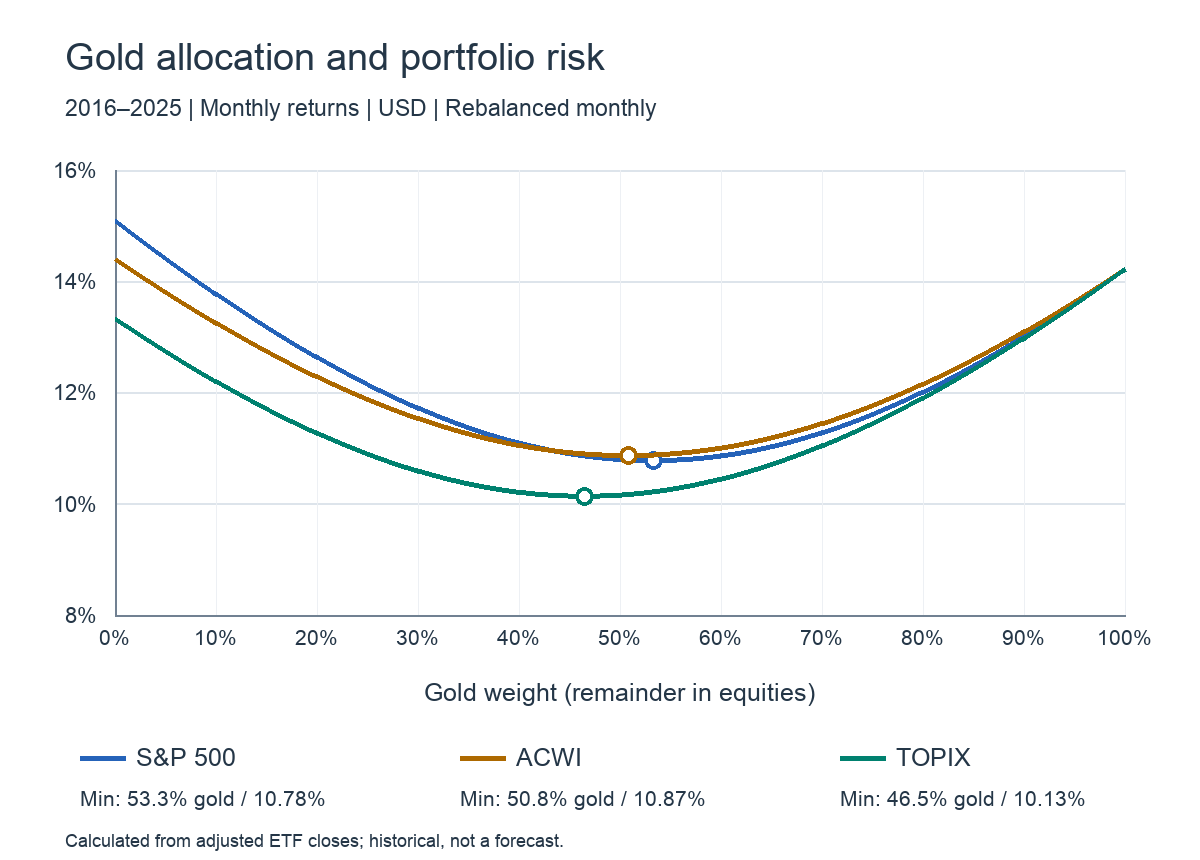
S&P 500 volatility fell from 15.08% alone to 10.78% with 53.3% gold. ACWI fell from 14.39% to 10.87% at 50.8% gold. USD-converted TOPIX fell from 13.32% to 10.13% at 46.5% gold. The valley retains both assets: replacing equities with more and more gold does not keep reducing risk. Gold alone had 14.21% volatility.
With gold weight w, portfolio variance is (1−w)² × equity variance + w² × gold variance + 2w(1−w) × covariance. The covariance term captures how the two move together. Low correlation brings combined volatility below a simple weighted average of individual volatilities. We verified the formula against volatility calculated directly from monthly portfolio returns.
The Sharpe peak need not sit at the volatility minimum
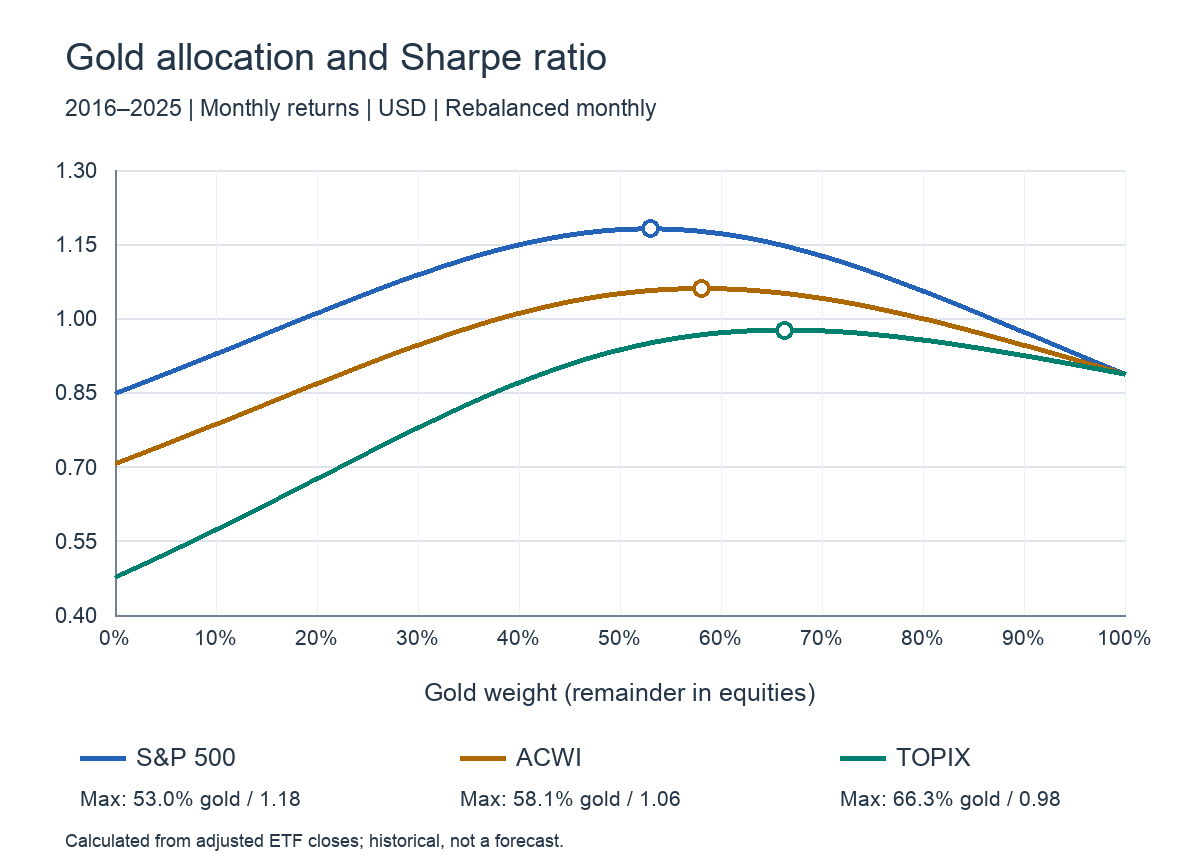
The Sharpe ratio divides returns above a cash benchmark by the volatility of those excess returns. Each month, we subtract the previous month’s US three-month Treasury bill rate, converted to a monthly rate by division by 12. Annualized Sharpe is mean monthly excess return ÷ sample excess-return standard deviation × √12. FRED’s TB3MS is a discount-basis yield: this is a cash-return approximation, not a reconstruction of a deposit or Treasury fund’s performance.
| Equity proxy | Gold at minimum risk | Minimum annual risk | Gold at maximum Sharpe | Maximum Sharpe |
|---|---|---|---|---|
| S&P 500 | 53.3% | 10.78% | 53.0% | 1.18 |
| ACWI | 50.8% | 10.87% | 58.1% | 1.06 |
| TOPIX | 46.5% | 10.13% | 66.3% | 0.98 |
The S&P 500 mix peaked at 53.0% gold and 47.0% equities, with Sharpe 1.18 versus 0.85 for equities alone. That nearly matches its 53.3% minimum-risk weight. ACWI’s Sharpe peak was 58.1% gold, above its 50.8% risk minimum. TOPIX’s gap was larger: 66.3% versus 46.5%.
The difference comes from rewarding return as well as reducing fluctuations. USD compound annual returns were 14.60% for gold, 14.72% for the S&P 500, 11.87% for ACWI and 7.86% for TOPIX. Gold’s stronger relative return tilted the ACWI and TOPIX Sharpe-optimal mixes toward gold, accepting somewhat higher volatility to gain more excess return. Sharpe’s numerator uses arithmetic mean monthly excess returns, not these compound annual returns.
Split the decade and the optimal weights change
Repeating the calculation for 2016–2020 and 2021–2025 gives the following maximum-Sharpe gold weights. The latter TOPIX sample reaches 92.3% gold. Strong gold performance shifts a return-sensitive optimization toward gold.
| Equity proxy | 2016–2020 | 2021–2025 |
|---|---|---|
| S&P 500 | 47.7% | 59.2% |
| ACWI | 51.2% | 68.5% |
| TOPIX | 54.8% | 92.3% |
The roughly one-half to two-thirds allocation is therefore an in-sample result for this decade, not a forecast generated from future expected returns. Minimum risk depends on volatility and correlation; maximum Sharpe also depends on mean returns and cash rates. Comparing the two five-year samples separates diversification from favoring the period’s stronger performer.
For a yen investor, currency is part of the mix
Convert the same series to JPY and repeat the calculation: the minimum-risk gold weights become 65.1% with the S&P 500, 60.8% with ACWI and 54.4% with TOPIX. A dollar result cannot simply be transferred to a yen-based household balance sheet.
| Equity proxy | Gold at minimum risk | Minimum annual risk | Gold at maximum Sharpe |
|---|---|---|---|
| S&P 500 | 65.1% | 10.49% | 64.0% |
| ACWI | 60.8% | 10.23% | 64.6% |
| TOPIX | 54.4% | 9.27% | 64.7% |
This sensitivity calculation uses a constant 0% cash benchmark, not a historical Japanese short-rate series. Do not directly compare its Sharpe levels with the main USD calculation. It shows how the currency and cash assumptions change allocation. JPY TOPIX and JPY gold had correlation +0.001, almost zero.
On the board, watch opposite days—and different recoveries
Place gold beside the S&P 500, ACWI and TOPIX, then add USD/JPY. Look for gold rising when equities fall, gold losing less during an equity sell-off, or gold holding its gains while equities struggle to recover. Opposite-direction days make the offset in a combined holding easy to see.
Days when both rise are valuable too. Equities may move sharply while gold advances more steadily, retaining gains from both without identical fluctuations. When both drop sharply together, diversification is weaker that day. The long-term mechanism is holding two return streams responding to different forces, not expecting protection every session.
Maximum Sharpe does not describe an instant when the two chart lines become mirror images. Across the sample, equity-led months, gold-led months and offsetting declines combine to deliver more excess return relative to total variation. Perfect opposite movements can cancel gains too. Ask not only whether the assets move oppositely, but whether they offset losses while retaining upside.
Compare printed percentages and quote timestamps, not line height. TOPIX and US stocks trade at different hours; gold and FX have different chart windows. This board’s gold chart tracks a perpetual contract reference price, while its daily equity charts track price moves. Our study instead uses a physically backed gold ETF and distribution-adjusted equity ETF returns. It is not calculated by stitching together the board’s daily charts. Use the board to observe today’s diversification, and aligned long-term returns to assess portfolio weights.
Calculation notes for reproducibility
Daily adjusted prices for GLD, SPY, ACWI, 1306.T and USD/JPY were obtained from Yahoo Finance and aggregated to each month’s last observed value. December 2015 provides the starting level for 120 monthly simple returns. No months were missing and no interpolation was applied. The cash proxy is lagged TB3MS ÷ 100 ÷ 12. Correlation is Pearson correlation; standard deviations use n−1. Gold weights run from 0% to 100% in 0.1-percentage-point steps, with no shorts, leverage or cash holdings. Data were retrieved and calculations performed on October 5, 2026. Sharpe uses excess-return volatility; the risk chart uses portfolio-return volatility, so changing cash rates make the denominators slightly different.
Data and references
- Yahoo Finance — historical adjusted ETF prices (GLD; also SPY, ACWI, 1306.T and USD/JPY)
- State Street — SPY
- iShares — ACWI
- Nomura — TOPIX ETF 1306
- SPDR Gold Shares — GLD
- Federal Reserve / FRED — TB3MS