Rising grocery bills, rents and energy costs change the starting point for investing. A cash balance can stay unchanged while buying less. Japan’s Statistics Bureau reported a 3.2% increase in the all-items CPI for the 2025 annual average. In the United States, BLS data show August 2026 inflation at 3.4% year over year. Purchasing power belongs at the center of portfolio evaluation.
Which assets withstand inflation? We calculated historical returns across four episodes: the postwar surge of 1946–1948, the first oil shock in 1973–1974, the second oil shock and monetary tightening in 1979–1981, and the recent surge in 2021–2023. The comparison covers U.S. stocks, large value and growth portfolios, 10-year Treasuries, Treasury bills and gold.
Two findings stand out. Long fixed-rate bonds struggled to preserve purchasing power, while large value stocks beat large growth stocks in all four selected periods. Gold dominated the two 1970s episodes, but did not repeat that performance in the recent surge. Inflation alone does not determine the winner: pricing power, interest rates and confidence in money matter too.
Inflation has been much harsher before
The postwar U.S. economy combined a shift from military production, supply constraints and pent-up demand. Federal Reserve History explains how the removal of price controls in 1946 released suppressed inflation. Prices rose 32.4% between December 1945 and December 1948. An unchanged $100 then bought only about $75.5 worth of the earlier basket.
Energy shocks compounded the inflation of the 1970s. Prices rose 22.1% across 1973–1974 and 38.8% across 1979–1981. The Fed’s Great Inflation history describes 1965–1982 as a prolonged episode involving energy shortages, monetary policy and changes in the international monetary system. Oil shocks amplified an inflation process already under way.
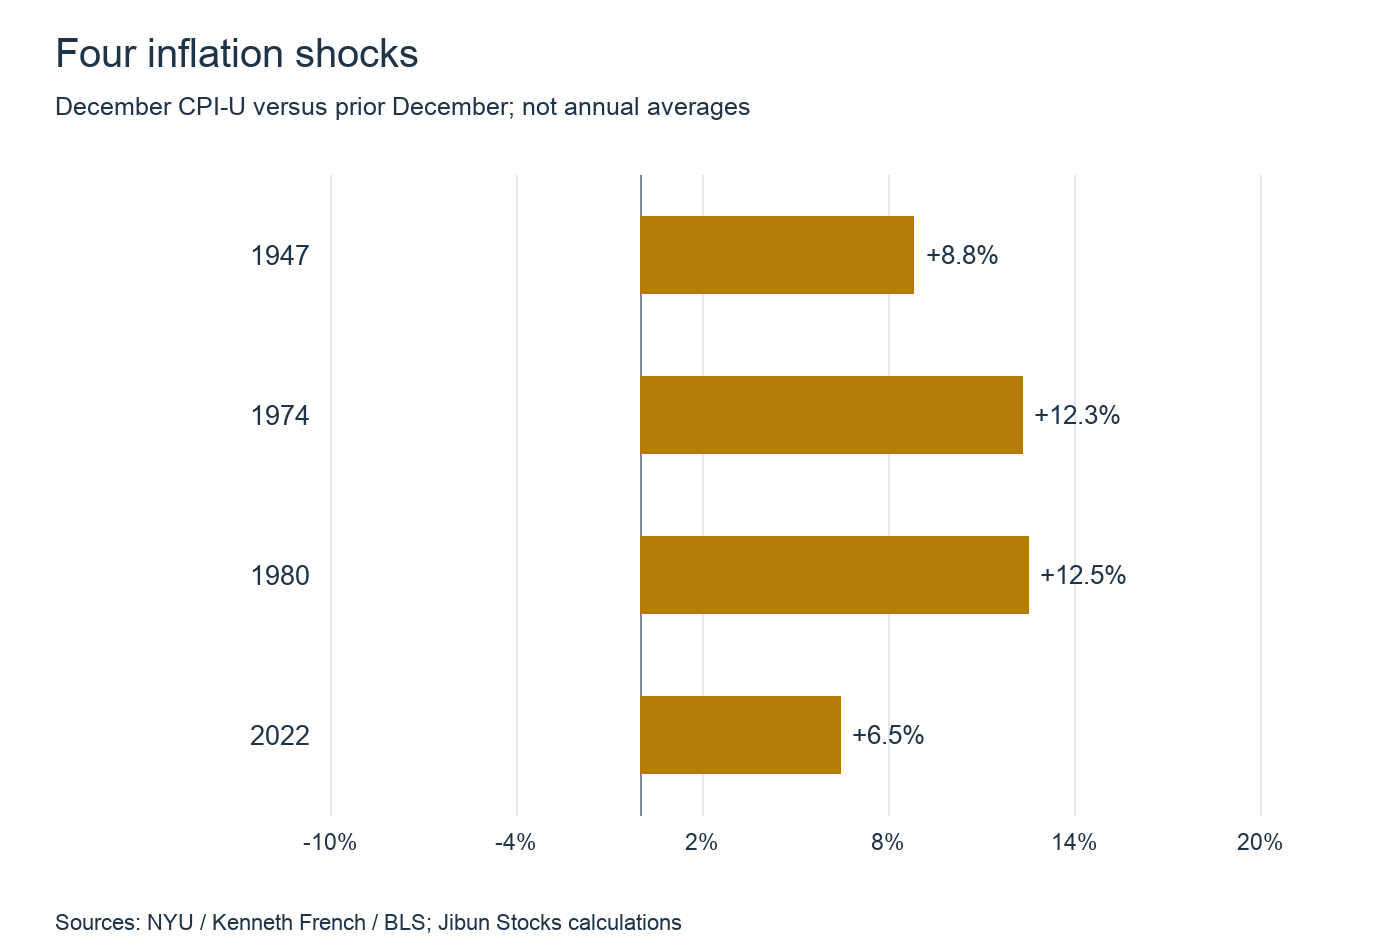
The recent episode combined recovering demand and disrupted supply with rising energy and food prices. U.S. CPI inflation reached 9.1% year over year in June 2022, then slowed to 6.5% by December. The chart below compares December with the previous December, not annual averages or intra-year peaks. Slower inflation does not reverse the price level: prices still rose a cumulative 17.8% across 2021–2023.
Money gains are not purchasing-power gains
An asset gaining 10% while prices rise 20% has lost purchasing power. We use real return = (1 + nominal return) / (1 + inflation) − 1, not simple subtraction. All results below are cumulative USD returns over complete calendar-year windows, rather than annualized returns. Equity and bond returns include dividends or interest as specified in the methodology.
| Period | CPI increase | Asset | Nominal | Real |
|---|---|---|---|---|
| 1946–1948 | +32.4% | U.S. stocks incl. dividends | +1.8% | -23.1% |
| 1946–1948 | +32.4% | Large value stocks | +5.1% | -20.6% |
| 1946–1948 | +32.4% | Large growth stocks | -3.5% | -27.1% |
| 1946–1948 | +32.4% | 10-year U.S. Treasury | +6.1% | -19.9% |
| 1946–1948 | +32.4% | 3-month Treasury bills | +2.0% | -22.9% |
| 1946–1948 | +32.4% | Gold | +0.0% | -24.5% |
| 1973–1974 | +22.1% | U.S. stocks incl. dividends | -36.5% | -48.0% |
| 1973–1974 | +22.1% | Large value stocks | -26.5% | -39.8% |
| 1973–1974 | +22.1% | Large growth stocks | -44.8% | -54.8% |
| 1973–1974 | +22.1% | 10-year U.S. Treasury | +5.7% | -13.4% |
| 1973–1974 | +22.1% | 3-month Treasury bills | +15.4% | -5.5% |
| 1973–1974 | +22.1% | Gold | +187.4% | +135.3% |
| 1979–1981 | +38.8% | U.S. stocks incl. dividends | +48.8% | +7.2% |
| 1979–1981 | +38.8% | Large value stocks | +63.1% | +17.5% |
| 1979–1981 | +38.8% | Large growth stocks | +45.4% | +4.7% |
| 1979–1981 | +38.8% | 10-year U.S. Treasury | +5.7% | -23.9% |
| 1979–1981 | +38.8% | 3-month Treasury bills | +39.8% | +0.7% |
| 1979–1981 | +38.8% | Gold | +75.9% | +26.7% |
| 2021–2023 | +17.8% | U.S. stocks incl. dividends | +32.7% | +12.7% |
| 2021–2023 | +17.8% | Large value stocks | +62.2% | +37.7% |
| 2021–2023 | +17.8% | Large growth stocks | +28.4% | +9.0% |
| 2021–2023 | +17.8% | 10-year U.S. Treasury | -18.4% | -30.7% |
| 2021–2023 | +17.8% | 3-month Treasury bills | +7.5% | -8.7% |
| 2021–2023 | +17.8% | Gold | +9.6% | -6.9% |
Postwar inflation: even gold was constrained by the monetary regime
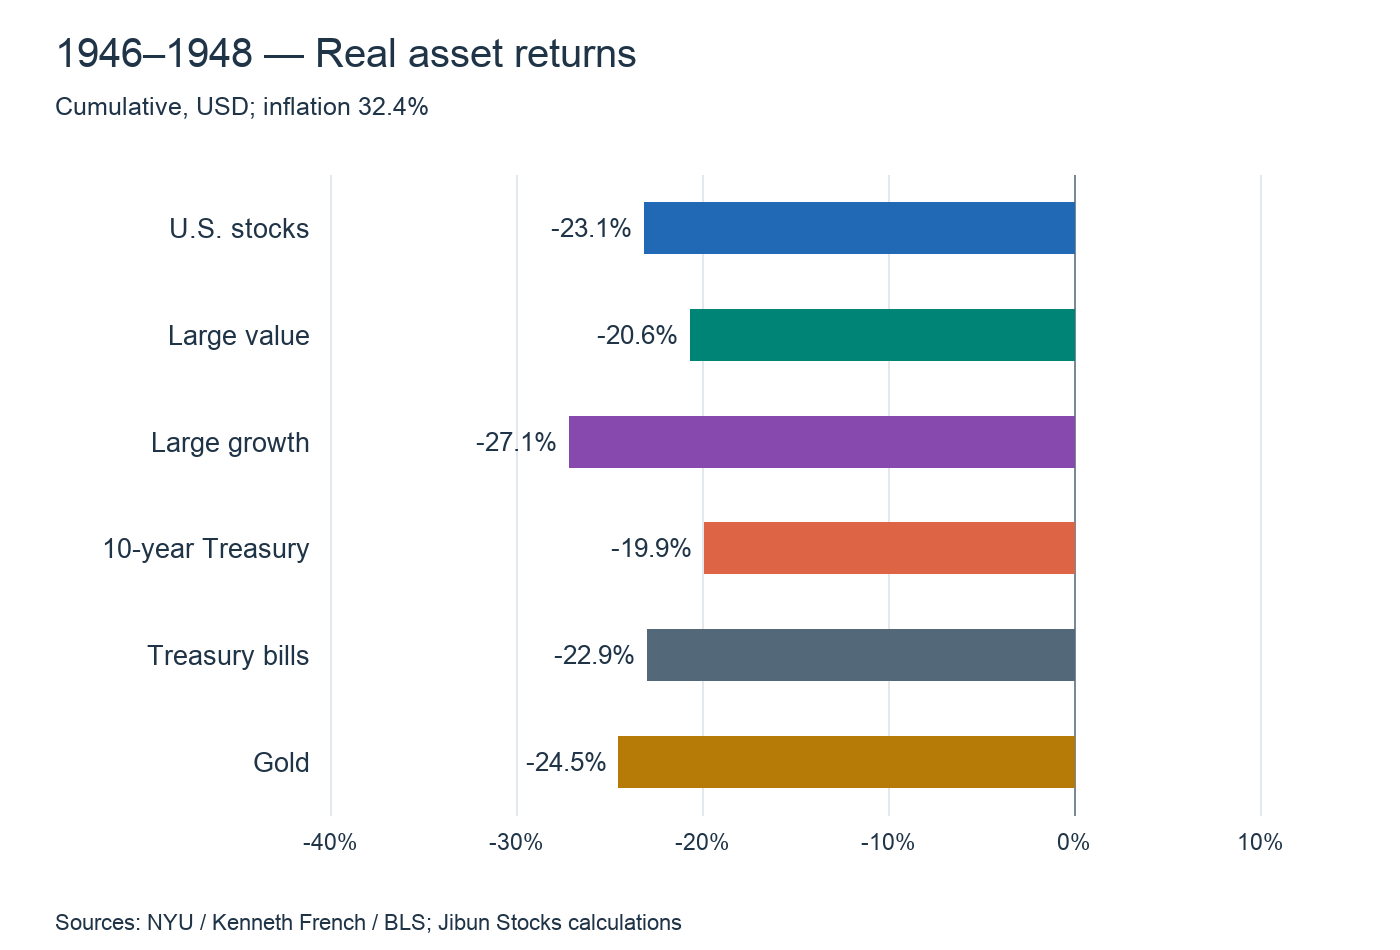
Across 1946–1948, U.S. stocks gained 1.8% nominally and 10-year Treasuries gained 6.1%. After the 32.4% rise in prices, their real returns were −23.1% and −19.9%. Large value returned −20.6% in real terms, compared with −27.1% for large growth. Investing by itself did not defeat inflation in this window.
Gold’s nominal return was 0.0%, producing a real loss of 24.5%. The monetary system relied on an official dollar-gold price, unlike today’s freely moving gold market, and U.S. private gold ownership faced restrictions. This is a comparison of the published price series, not an attainable return for an unrestricted retail gold strategy at the time. Institutions and market rules shape an asset’s inflation response.
The first oil shock: gold surged while stocks lost purchasing power
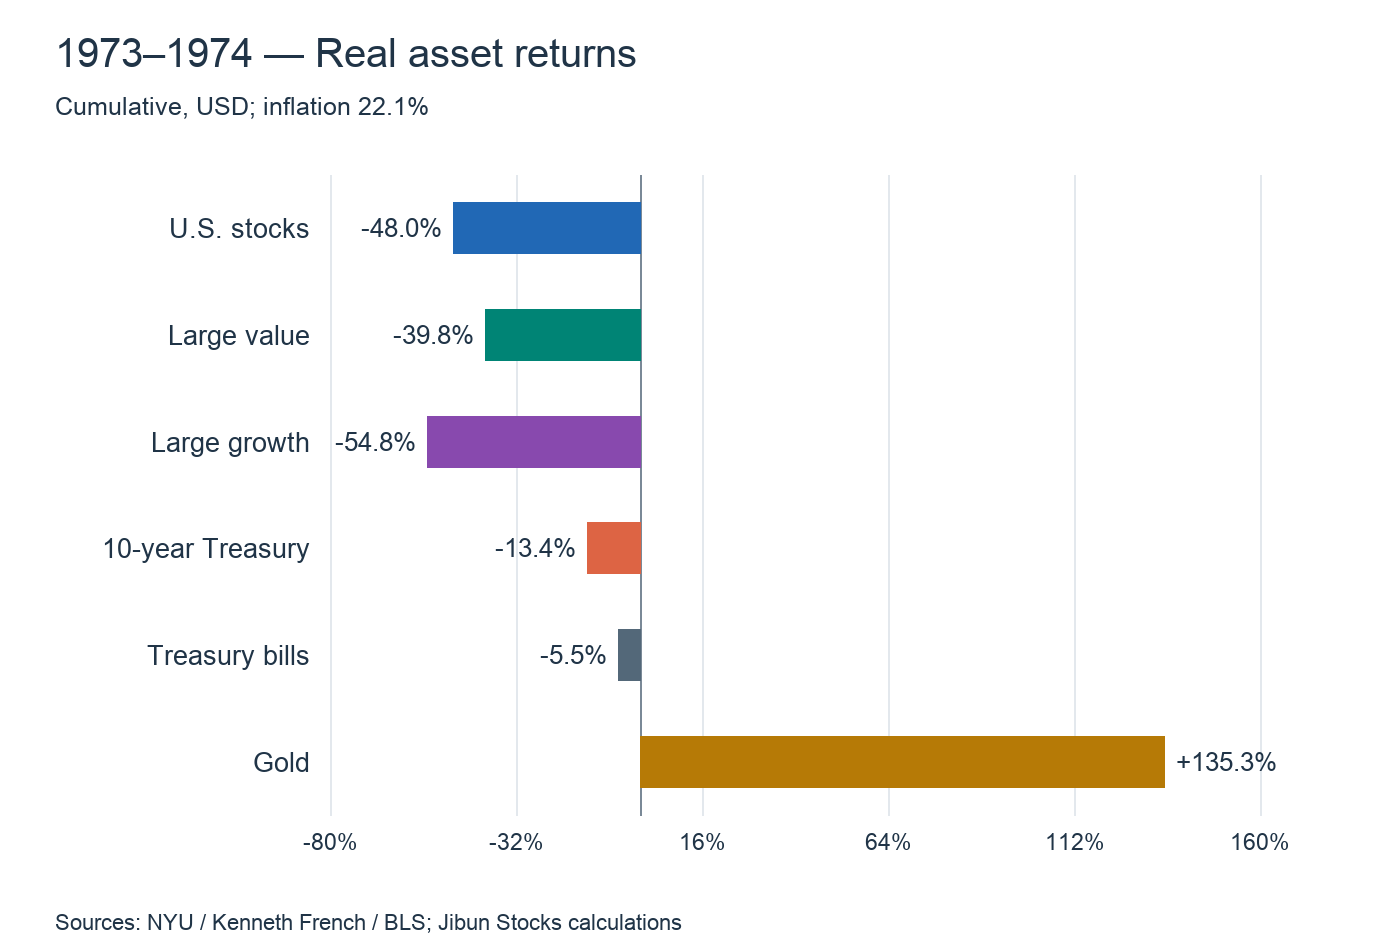
In 1973–1974, gold gained 187.4% nominally and 135.3% after inflation. U.S. stocks lost 36.5% nominally and 48.0% in real terms. Large growth lost 54.8% in real terms, versus 39.8% for large value. Value lost less, but neither equity style provided shelter. Treasury bills also returned −5.5% after inflation.
The gold result reflects more than CPI. After the end of dollar-gold convertibility in 1971, gold was being repriced away from its former official anchor. Eroding monetary confidence alongside inflation offers a compelling explanation for the demand for an asset that pays no interest.
Stocks faced higher energy and input costs, weakening demand and rising rates. Growth valuations depend more heavily on distant earnings, making a higher discount rate especially painful. Value’s greater emphasis on current earnings and assets helped it withstand the shock relatively better.
The second oil shock: stocks recovered but bonds fell behind prices
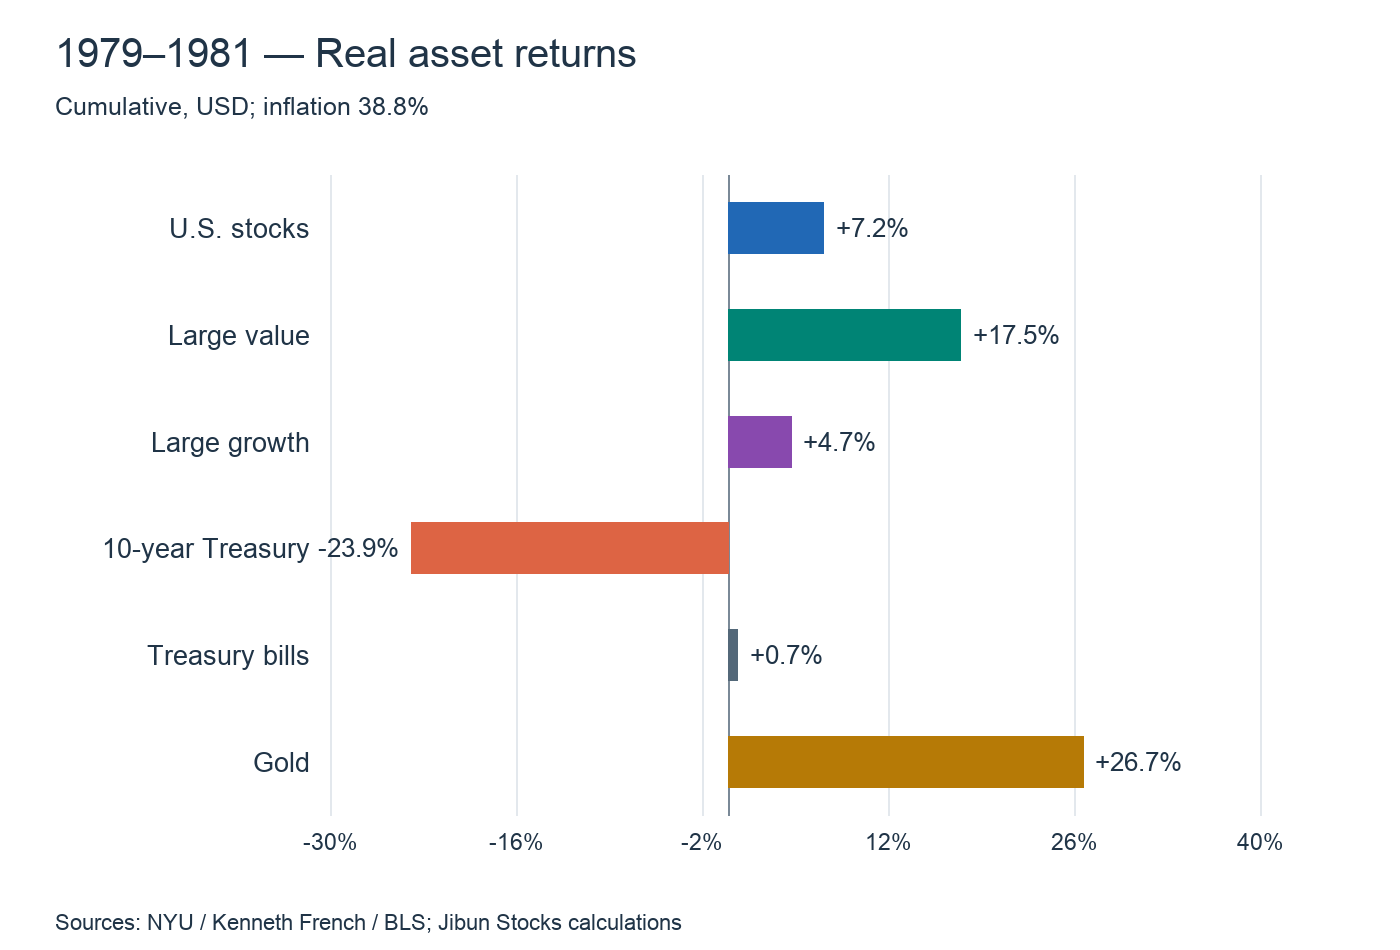
During 1979–1981, inflation was harsher yet equity returns improved. U.S. stocks gained 48.8% nominally and 7.2% in real terms. Large value’s real gain was 17.5%, versus 4.7% for large growth. Gold led at 26.7% real, while 10-year Treasuries lost 23.9%. Bills earned 39.8% nominally and narrowly kept up with prices, returning 0.7% real.
The maturity of the fixed payment makes the difference. Bills mature and reset quickly into higher rates. Long bonds retain older coupons, and their prices fall when market yields rise. “Bonds” is too broad a label for these different responses.
Pricing power, nominal revenue growth and recovery from depressed valuations offer a useful reading of equity resilience. Inflation lifts both revenues and costs; retaining profit is the decisive business ability. Gold also fell 32.6% nominally in 1981 alone. A strong cumulative inflation-era result can contain a severe reversal as monetary tightening progresses.
Recent inflation: value led, gold lost purchasing power
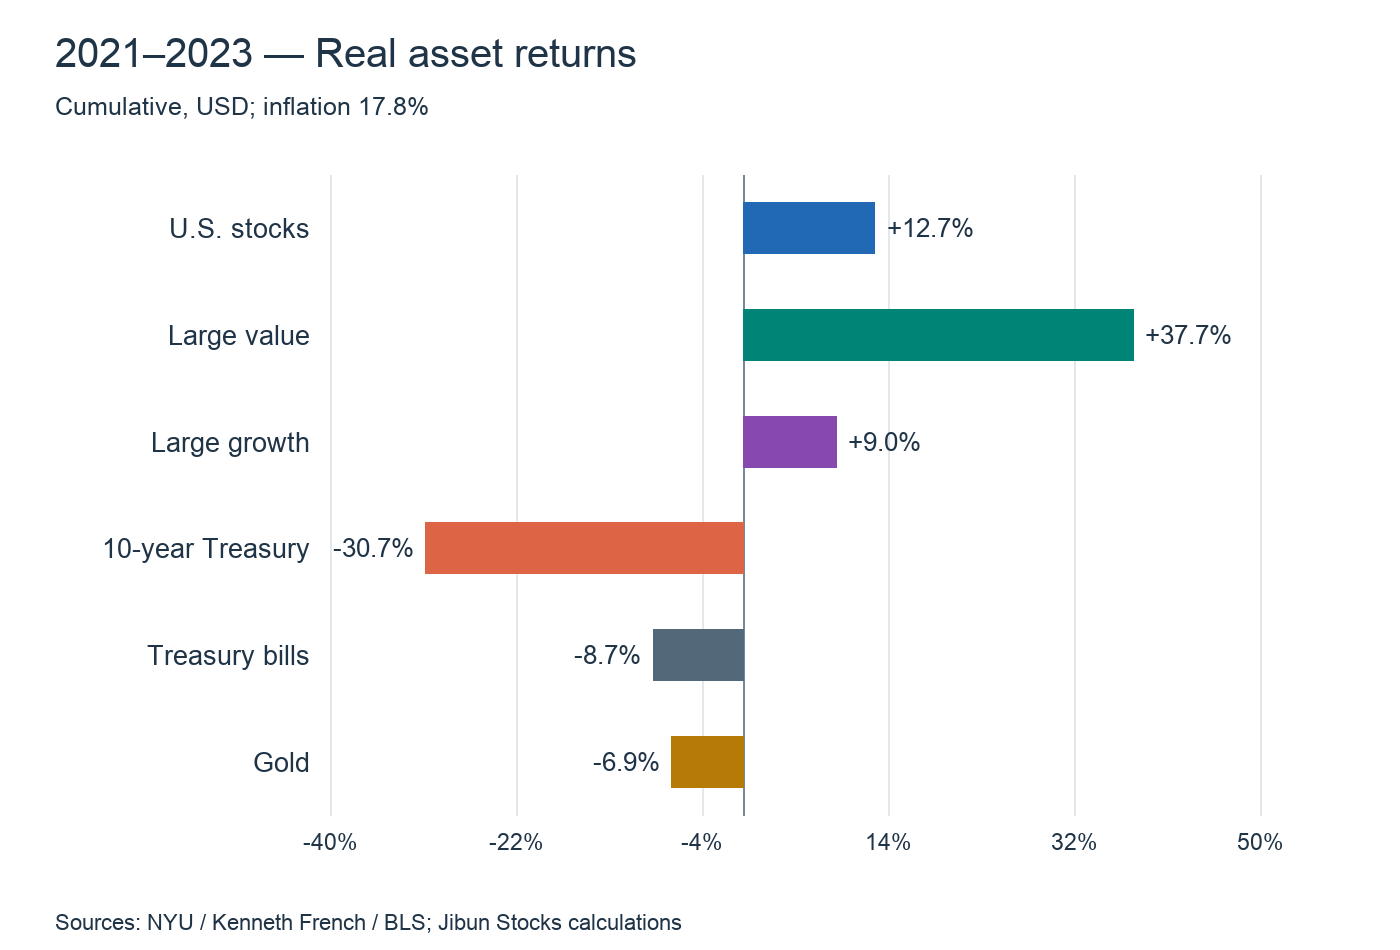
Across 2021–2023, large value gained 62.2% nominally and 37.7% in real terms. Broad U.S. stocks gained 12.7% real and large growth 9.0%. Gold gained 9.6% nominally but trailed the 17.8% increase in prices, leaving a real loss of 6.9%. The 10-year Treasury series lost 30.7% in real terms.
Rapid rate increases mattered alongside inflation. Gold generates no interest, so competing interest-bearing assets become more attractive as yields rise; the dollar also affects USD gold prices. For equities, pricing power and sector composition divide the outcomes. Value portfolios tend to include financial and resource businesses, while growth places more weight on expected future profits. Those differences in composition and rate sensitivity provide a strong explanation for value’s advantage in this sample.
Isolate 2022 to see the tightening shock
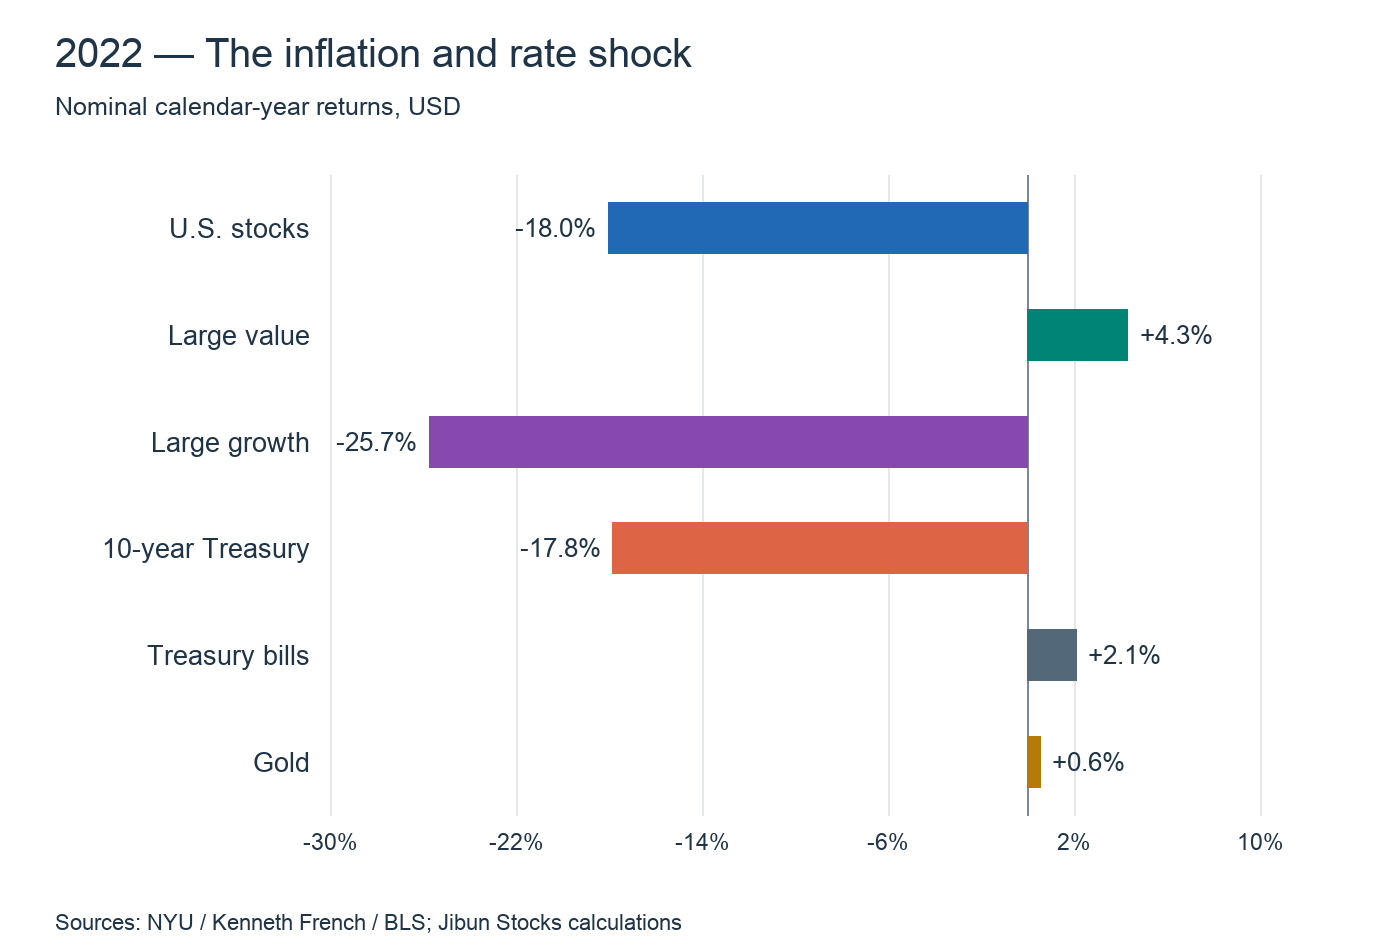
In 2022, nominal returns were −18.0% for U.S. stocks, −25.7% for large growth and −17.8% for 10-year Treasuries. Large value gained 4.3%, bills 2.1% and gold 0.6%. Value’s relative strength and gold’s nominal resilience are clear, but December inflation was 6.5%: holding the nominal line is not the same as increasing purchasing power.
The three-year comparison includes the equity rebound in 2023. Looking only at the full window softens the experience of the tightening year. Assess both cumulative purchasing power and the loss during the most forceful rate adjustment.
Strength comes from adapting to prices and interest rates
Large value beat large growth in every selected window; 10-year Treasury real returns were negative in all four. Gold led the two 1970s episodes but failed to preserve purchasing power in the postwar and recent windows. Bills reset faster than long bonds, yet can still lag prices when inflation accelerates first.
The useful framework is not a memorized list of asset names. For companies, examine the ability to turn higher selling prices into profits. For bonds, examine how quickly interest income can reset. For gold, follow monetary anxiety and real interest rates. The more persistent inflation becomes, the more attention current earning power and price flexibility deserve relative to distant fixed payments. These are distinct roles to consider when combining value stocks, short-term assets and gold.
Watch yields and stocks together on this board
On Jibun Stocks, build a comparison tab containing the U.S. 10-year yield, VTV, VUG, the S&P 500 and gold. Rising yields alongside weaker VUG and relatively stronger VTV reveal pressure on distant-profit valuations. When yields and stocks rise together, examine whether earnings or economic strength are overcoming the rate burden.
Add TLT or BND to distinguish rising bond yields from falling bond prices: a positive yield change does not mean a bond investment made money. Strong gold alongside weak equities and long bonds gives another window into how inflation and monetary concerns are being priced. USD/JPY adds the currency effect for yen-based investors.
VTV and VUG are current ETFs, not the historical research portfolios in this analysis. Regular-market and 24-hour charts also have different reference points. Match clock-time movements and quote timestamps for daily observation, then use dividends, interest and inflation for long-run evaluation. The board shows current relationships; the historical calculations explain the broader context.
Data and calculation
U.S. stocks, 10-year Treasuries, bills and gold use Aswath Damodaran’s NYU annual return table. Stocks use the dividend-inclusive S&P 500 historical series, including its historical predecessors in older years. Treasury returns include coupon income and price changes. Bills use the source’s annual-average three-month rate as an approximation of annual earnings. Gold uses price changes. Compounding uses the source’s annual percentages rounded to two decimals.
Value and growth use the Kenneth French six size/book-to-market portfolios: BIG HiBM and BIG LoBM, respectively. Value-weighted monthly returns are compounded across each calendar year. These are research portfolios, not back-extended ETFs; “growth” here denotes the low book-to-market classification.
Inflation uses BLS non-seasonally adjusted CPI-U obtained through FRED, from December before the first year to December of the last year. Taxes, additional trading costs and currency conversion are excluded. The four event-selected windows differ in length and are historical case studies, not an exhaustive rules-based classification of inflation regimes. Oil spot-price gains differ from futures investment returns, and house-price appreciation differs from rental-inclusive property returns; neither is placed in this like-for-like ranking. Retrieved and calculated on October 8, 2026.
Data and references
- NYU / Aswath Damodaran — Historical asset returns
- Kenneth French — Six size and book-to-market portfolios
- BLS / FRED — CPI-U, not seasonally adjusted
- Federal Reserve History — The Great Inflation
- Federal Reserve History — WWII to the Treasury-Fed Accord
- Federal Reserve History — Gold Convertibility Ends