Cash arriving in a brokerage account makes investing tangible. In the Japan Securities Dealers Association’s 2025 survey, 21.4% of 3,638 stockholders selected an investment policy emphasizing dividends, distributions or interest. A 2025 study described by Vanguard found that about half of the surveyed equity-income-fund investors preferred dividend-paying companies. These are different surveyed populations, not a like-for-like ranking of Japanese and American investors, but both show an enduring attraction to income.
We prioritized quarterly-distributing equity ETFs. SPY and VXUS, supplemented by a small position in Tokyo-listed 1489, covered all twelve payment months in 2025. A simpler alternative keeps broad-market VTI and VXUS and transfers their quarterly distributions from a cash account each month. Receiving a payment every month and receiving the same amount every month are separate designs.
Why ETFs help—and why distributions are not always profits
SPY provides large-cap U.S. equity exposure, VTI spans large, mid and small U.S. companies, and VXUS covers developed and emerging markets outside the U.S. One exchange-traded holding can replace a long list of individual dividend stocks. Large funds such as SPY have deep trading activity; access, spreads, commissions and share units still depend on the broker.
U.S. ETFs can distribute Return of Capital, or ROC. Japan’s investor-specific special-distribution classification is not the same system. Its absence does not mean that every U.S. ETF distribution comes solely from profits. The IRS describes nondividend distributions that reduce U.S. tax basis; Japanese-resident taxation is a separate calculation. A distribution also moves assets out of the fund, so evaluate price gains and distributions together rather than treating yield as free additional return.
Three quarterly funds, twelve payment months
Use payment dates, not declaration or ex-dividend months. SPY paid in January, April, July and October in 2025. VXUS paid in March, June, September and December. Tokyo-listed 1489 paid in February, May, August and November. Together, these cover all twelve months without a monthly equity-income fund.
| ETF | Exposure | Distribution | 2025 payment months |
|---|---|---|---|
| VTI | U.S. total market | Quarterly | 3 / 7 / 10 / 12 |
| VXUS | Ex-U.S. developed + emerging | Quarterly | 3 / 6 / 9 / 12 |
| SPY | S&P 500 large caps | Quarterly | 1 / 4 / 7 / 10 |
| 1489 | Japan high-dividend 50 | Quarterly | 2 / 5 / 8 / 11 |
| BND | U.S. investment-grade bonds | Monthly | 2–12; twice in December |
SPY’s January payment belongs to the preceding December entitlement. Buying in January does not earn that month’s existing distribution. Fund payment dates are also different from broker credit dates: month-end processing can push a visible account credit into the next month.
1489 selects 50 high-dividend companies from the Nikkei 225 universe. It is not a world market portfolio. VXUS already contains Japan, so adding 1489 creates extra Japanese high-dividend exposure. SPY also omits the broad mid- and small-cap exposure present in VTI. The ladder changes both payment timing and investments. For U.S. readers, 1489 is a Tokyo-listed implementation example, not a claim of universal U.S.-broker access; the U.S.-listed core-and-cash alternative avoids that requirement.
Five portfolios, with diversification defined first
The global core uses 62% VTI and 38% VXUS. This is a fixed modeling allocation, not an automatic replication of changing world market-cap weights. The quarterly ladder uses 62% SPY, 33% VXUS and 5% 1489. Its 60/40 version scales the equity sleeve to 60% and adds 40% BND. BND’s monthly distributions complement a bond allocation; they are not the reason to change equity exposure. VTI alone provides a U.S.-only reference.
| Portfolio | VTI | VXUS | BND | SPY | 1489 | Weighted fee |
|---|---|---|---|---|---|---|
| Global core | 62% | 38% | 0% | 0% | 0% | 0.038% |
| Quarterly ladder | 0% | 33% | 0% | 62% | 5% | 0.090% |
| Global core 60/40 | 37.2% | 22.8% | 40% | 0% | 0% | 0.035% |
| Quarterly ladder 60/40 | 0% | 19.8% | 40% | 37.2% | 3% | 0.066% |
| US core | 100% | 0% | 0% | 0% | 0% | 0.030% |
Weighted published expense rates were checked in October 2026. They are not total trading costs. The equity-only ladder contains three quarterly payers; even in the 60/40 ladder, the entire equity sleeve remains quarterly-distributing.
Monthly payments: $9 in February, $763 in December
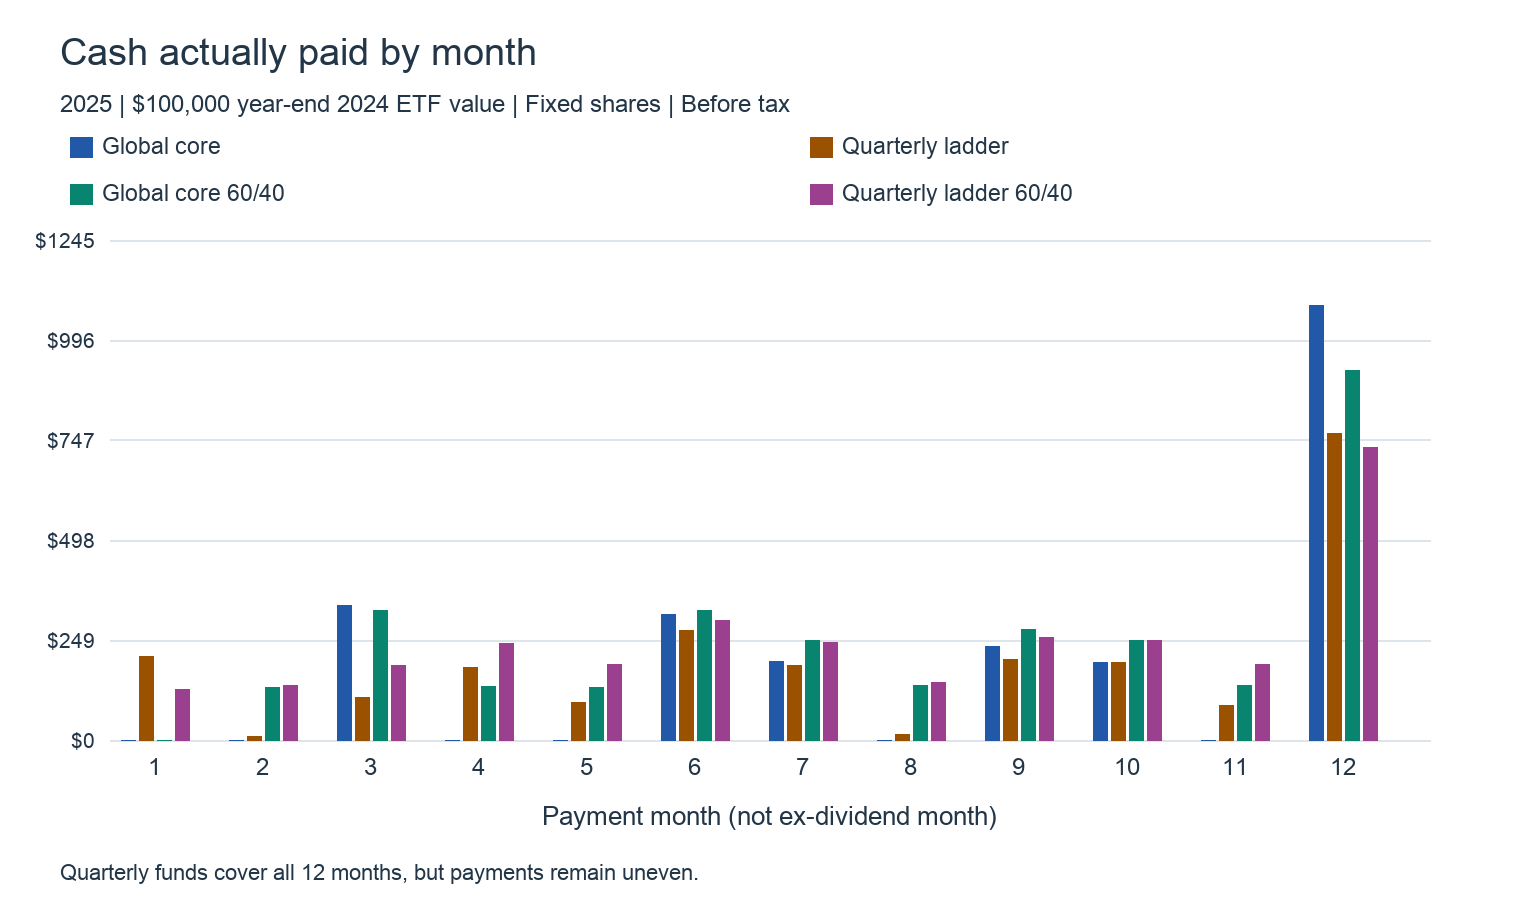
The income calculation holds fixed shares worth $100,000 at year-end 2024. It assumes an existing holder already entitled to SPY’s December 2024 distribution, rather than a new December 31 purchase. Distributions paid during 2025 are gross of tax. Yen distributions from 1489 are translated at the latest available USD/JPY close on or before their payment date.
| Portfolio | Annual income | Monthly average | Lowest month | Months paid | Starting reserve |
|---|---|---|---|---|---|
| Global core | $2,350 | $196 | $0 | 6 | $887 |
| Quarterly ladder | $2,311 | $193 | $9 | 12 | $571 |
| Global core 60/40 | $3,000 | $250 | $0 | 11 | $670 |
| Quarterly ladder 60/40 | $2,976 | $248 | $125 | 12 | $481 |
| US core | $1,296 | $108 | $0 | 4 | $318 |
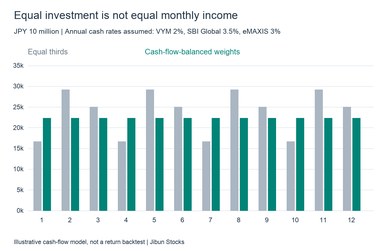
The quarterly ladder paid $2,311 for the year, averaging $193 a month. It paid in all twelve months, but February contributed only about $9 and August about $14. The small Japanese sleeve and Japan’s uneven corporate-dividend season make those months thin. December reached $763 through VXUS. Literal monthly payments do not deliver an even monthly paycheck.
| Month | Global core | Quarterly ladder | Global core 60/40 | Quarterly ladder 60/40 |
|---|---|---|---|---|
| 1 | $0 | $208 | $0 | $125 |
| 2 | $0 | $9 | $131 | $136 |
| 3 | $334 | $107 | $322 | $186 |
| 4 | $0 | $179 | $134 | $241 |
| 5 | $0 | $93 | $131 | $187 |
| 6 | $313 | $272 | $321 | $296 |
| 7 | $195 | $186 | $248 | $243 |
| 8 | $0 | $14 | $135 | $143 |
| 9 | $232 | $202 | $274 | $256 |
| 10 | $194 | $194 | $248 | $248 |
| 11 | $0 | $85 | $136 | $187 |
| 12 | $1,082 | $763 | $920 | $728 |
The global core paid $2,350 across six months. VTI paid in March, July, October and December in 2025; VXUS added June and September. BND’s 2025 schedule had no January payment and two December payments. Even a “monthly” label is not proof of a payment in every calendar month.
A cash account preserves the broad portfolio
Collect distributions in cash and transfer a fixed amount each month. Using the actual 2025 total divided by twelve, with receipts and withdrawals aggregated at month-end, the global core needed a starting reserve rounded up to $887 to transfer about $196 monthly. The ladder needed $571 to transfer about $193. This converts quarterly receipts into monthly withdrawals without changing the investment universe.
Those are hindsight calculations using the known annual total. A practical policy starts from the previous year’s after-tax distributions, sets a conservative transfer and reviews cash annually. The reserve is additional to the $100,000 ETF allocation and is excluded from the ETF volatility and Sharpe calculations. If total capital is capped at $100,000, allocating part to cash reduces the ETF holdings and distributions. No reserve interest is credited here.
Volatility and Sharpe depend on holdings, not payday
We compared January 2018 through December 2025 with monthly target-weight rebalancing and distributions reinvested. All returns are in U.S. dollars, including 1489’s Japanese equities and yen currency exposure. Volatility measures annualized monthly variation; Sharpe measures excess returns over a short Treasury-rate proxy.
| Portfolio | Volatility | Sharpe | CAGR | Max drawdown |
|---|---|---|---|---|
| Global core | 15.98% | 0.582 | 11.08% | -25.46% |
| Quarterly ladder | 15.38% | 0.631 | 11.63% | -24.20% |
| Global core 60/40 | 10.89% | 0.488 | 7.51% | -21.11% |
| Quarterly ladder 60/40 | 10.52% | 0.529 | 7.81% | -20.32% |
| US core | 16.95% | 0.690 | 13.59% | -24.82% |
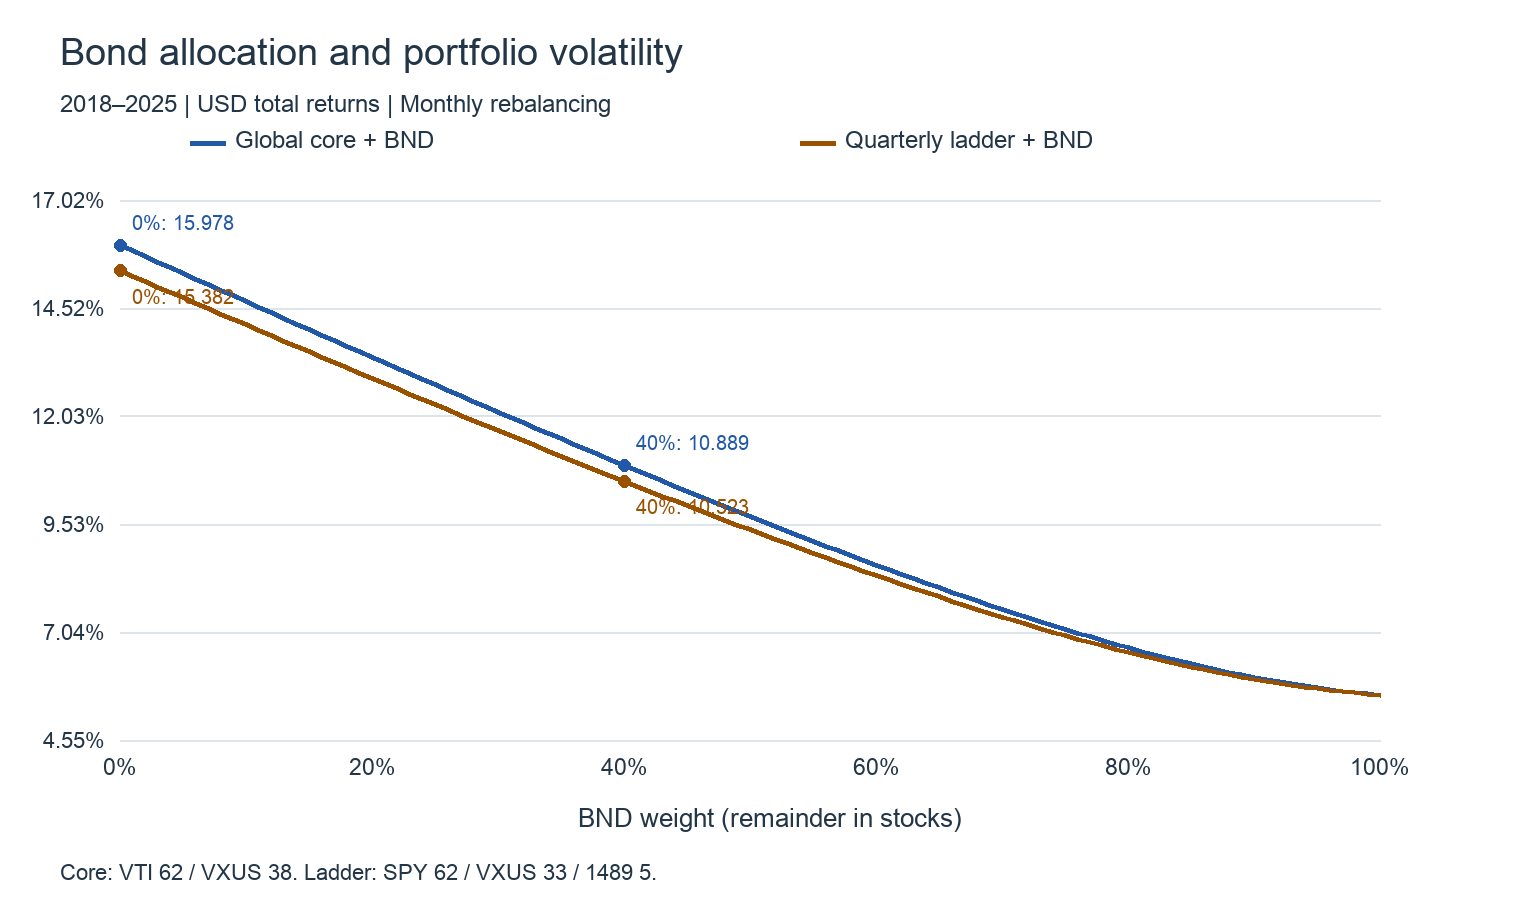
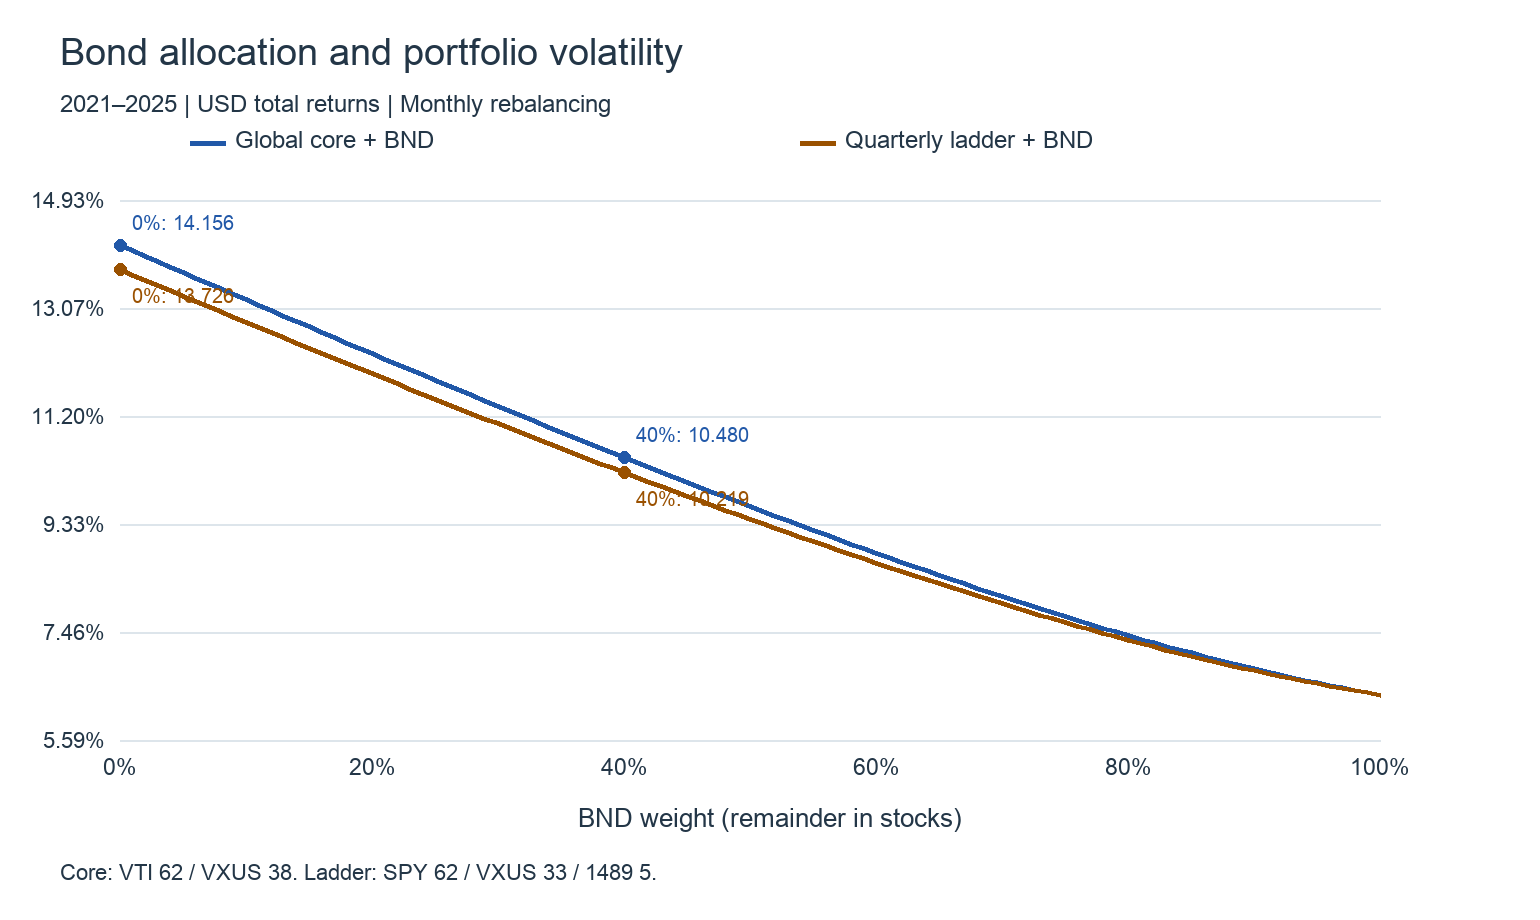
Global-core volatility was 15.98%, versus 15.38% for the ladder. At 60/40 it fell to 10.89% and 10.52%. The stock/bond decision had a much larger effect than switching to the payment ladder. Both minimum-volatility curves end at 100% BND: a different portfolio that removes the equity growth allocation.
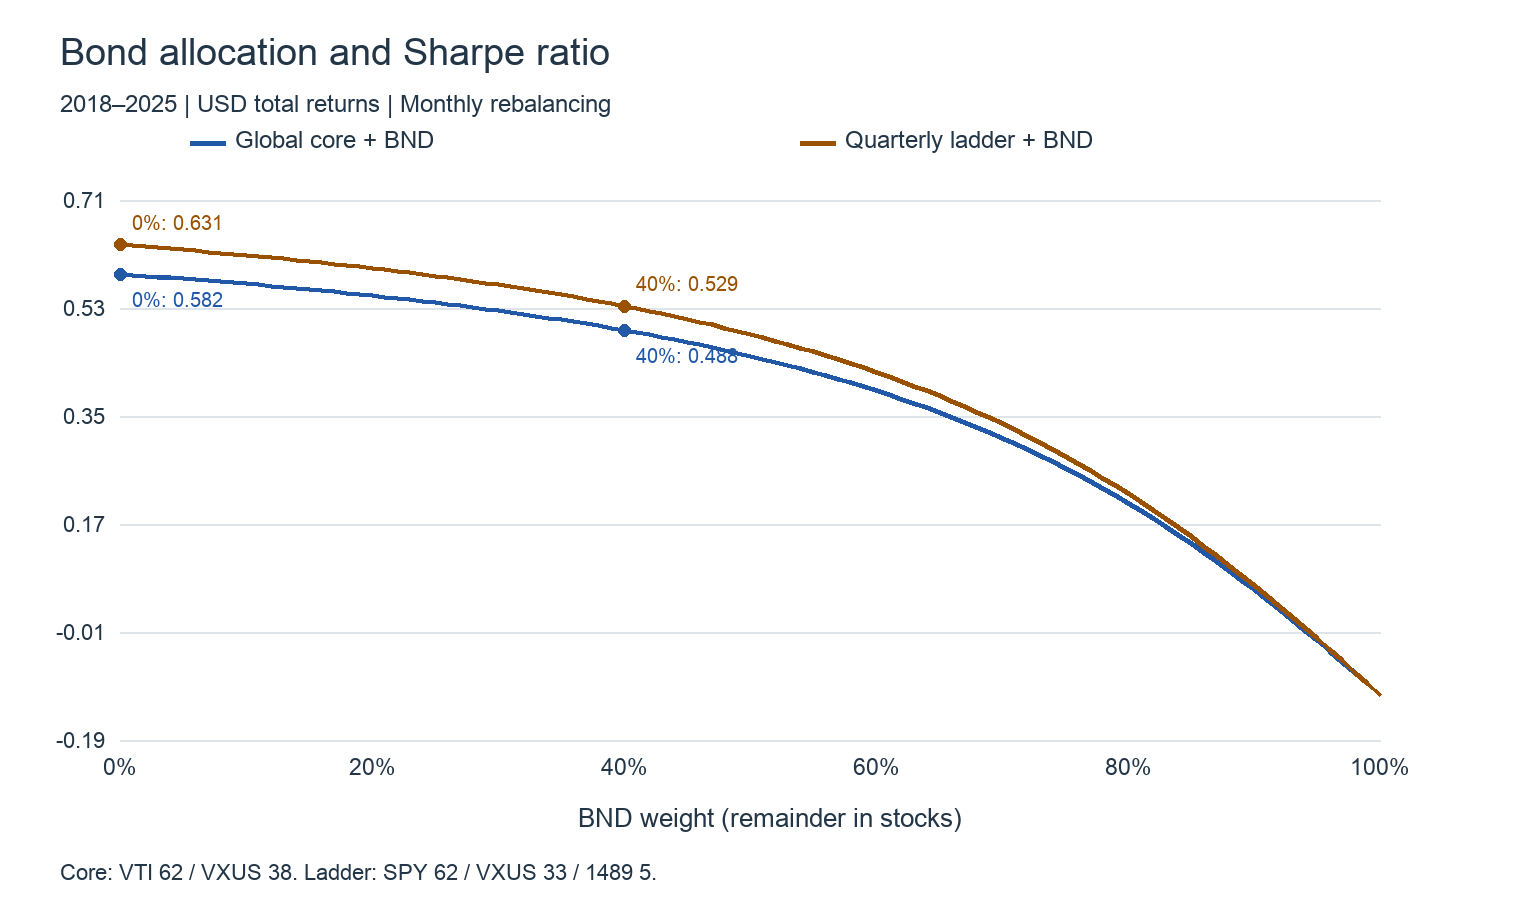
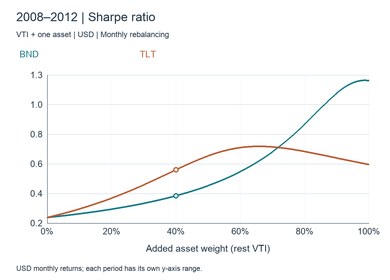
Full-sample Sharpe was 0.582 for the global core and 0.631 for the ladder; their 60/40 versions delivered 0.488 and 0.529. Both curves peaked at zero bonds in this sample. This does not mean extra payment dates create returns. The switch from VTI to SPY, the Japanese dividend tilt, reduced VXUS allocation and yen movements change the result. Payday itself is not an independent source of return.
Change the period and the ranking changes
| Period | Portfolio | Volatility | Sharpe | CAGR |
|---|---|---|---|---|
| 2018–2020 | Global core | 18.84% | 0.558 | 10.79% |
| 2018–2020 | Quarterly ladder | 18.01% | 0.538 | 10.07% |
| 2018–2020 | Global core 60/40 | 11.68% | 0.673 | 9.08% |
| 2018–2020 | Quarterly ladder 60/40 | 11.15% | 0.661 | 8.62% |
| 2021–2025 | Global core | 14.16% | 0.606 | 11.26% |
| 2021–2025 | Quarterly ladder | 13.73% | 0.708 | 12.58% |
| 2021–2025 | Global core 60/40 | 10.48% | 0.361 | 6.57% |
| 2021–2025 | Quarterly ladder 60/40 | 10.22% | 0.438 | 7.32% |
| 2022 | Global core | 21.51% | -0.903 | -18.09% |
| 2022 | Quarterly ladder | 21.39% | -0.803 | -16.17% |
| 2022 | Global core 60/40 | 15.64% | -1.142 | -15.89% |
| 2022 | Quarterly ladder 60/40 | 15.58% | -1.059 | -14.73% |
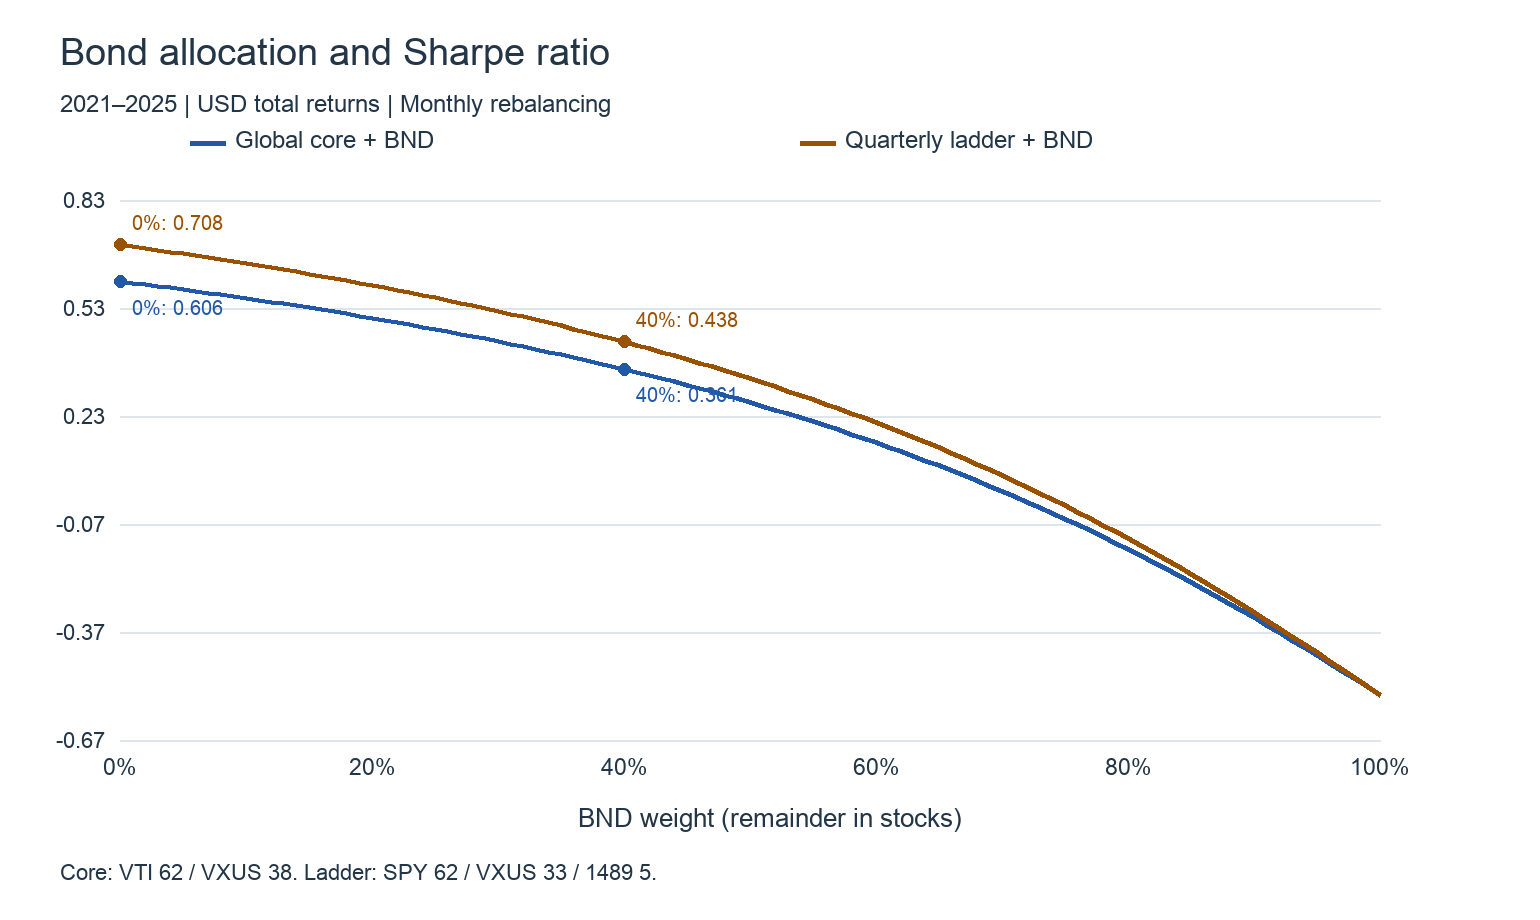
In 2018–2020, the equity ladder’s Sharpe was 0.538 versus 0.558 for the core. In 2021–2025, it led at 0.708 versus 0.606. In 2022, even the global-core 60/40 portfolio lost 15.89%. Receiving cash did not erase simultaneous stock and bond losses.
VTI/BND monthly correlation rose from 0.464 in the full sample to 0.641 in 2021–2025. Bonds were less volatile, not consistently opposite to stocks. VTI/SPY correlation was 0.996. Owning both adds highly similar U.S. equity exposure, not a separate defensive asset. Payment-calendar diversification and return diversification are different measurements.
My selection: core first; ladder for actual monthly receipts
For straightforward broad diversification, I favor VTI plus VXUS and a cash account. Add BND when a lower equity weight serves the risk objective; use 60/40 as a starting comparison, not a promise that bonds always hedge stocks.
For investors who value an actual fund payment every month and can access Tokyo ETFs, the quarterly ladder is 62% SPY, 33% VXUS and 5% 1489. The Japanese ETF is a small supplement. For a thicker minimum-income month, the 60/40 ladder uses 37.2% SPY, 19.8% VXUS, 3% 1489 and 40% BND. Its lowest 2025 month was about $125. Payments still remain uneven.
Increasing 1489 substantially just to fill February and August would strengthen the Japanese high-dividend tilt. Set investments by growth and risk objectives, then smooth the receipts with cash. That order keeps the pleasure of dividends compatible with sensible diversification.
Using this board
Compare the S&P 500 with VTI for shared U.S. equity moves, and VXUS for relative strength outside the U.S. If BND falls alongside stocks, investigate common interest-rate pressure. If it rises while stocks fall, it is cushioning that particular episode. Track repeated joint selloffs and recoveries rather than inferring a multi-year correlation from a single day.
1489 trades in Tokyo, while the U.S. ETFs trade in a different session. Its yen chart also differs from the dollar-translated returns above. Adding USD/JPY shows the currency link: yen weakness can lift a Japanese investor’s translated U.S. holdings while reducing a dollar investor’s return from Japanese assets. Daily price charts exclude reinvested distributions and serve a different role from long-term total-return statistics.
Data and calculation rules
Calculated October 12, 2026. December 2017 supplies the starting value for 96 monthly returns through December 2025. VTI, VXUS, BND and SPY use Yahoo Finance distribution-adjusted daily prices, sampled on each month’s last trading day. 1489’s upstream distribution events contained duplicates and an unadjusted pre-split amount. We therefore rebuilt its monthly return from split-adjusted month-end prices and the issuer’s distribution history, reinvesting at month-end. Historical distributions are adjusted for the January 2024 30-for-1 split. Market and FX month-end closes have time differences.
1489’s yen monthly return is (ending price + monthly distribution)/previous ending price − 1. The dollar growth factor multiplies its yen factor by previous/current USD/JPY. Portfolio returns are weighted sums of ETF monthly returns. Volatility is sample standard deviation × √12. Sharpe is mean monthly excess return/sample standard deviation × √12, using the prior month’s FRED TB3MS annual rate divided by twelve. CAGR compounds all monthly returns; maximum drawdown includes the initial value and monthly peaks, not daily extremes.
Performance assumes reinvestment and monthly rebalancing. Income assumes fixed shares and no reinvestment; the two figures are not added together. Payment inputs use Vanguard’s calendar, SPY payment history and Nomura’s distribution notices. Vanguard amounts retain the downloaded three-decimal precision. 1489 income is received in yen and translated to dollars for comparison. Fractional holdings are modeled; real orders require share-unit rounding. Taxes, commissions, conversion costs and cash interest are excluded. This is not a Japanese investor’s after-tax yen income schedule.
Data and references
- 日本証券業協会 / JSDA — 2025 survey, stockholders’ investment policy
- Vanguard — Inside the minds of equity income fund investors
- IRS — Nondividend distributions and return of capital
- Vanguard — 2025 official payment schedule
- State Street — SPY fund information
- Stock Analysis / S&P Global Market Intelligence — SPY payment history
- NEXT FUNDS — 1489 holdings, fees and historical distributions
- NEXT FUNDS — 1489 January 2025 distribution
- NEXT FUNDS — 1489 April 2025 distribution
- NEXT FUNDS — 1489 July 2025 distribution
- NEXT FUNDS — 1489 October 2025 distribution
- Vanguard — VTI factsheet
- Vanguard — VXUS factsheet
- Vanguard — BND factsheet
- Yahoo Finance — Historical ETF and FX prices
- FRED — Three-month Treasury bill rate, TB3MS