When the Fear & Greed Index reaches extreme fear, it is tempting to stop regular purchases, build cash and invest everything at the next attractive signal. Waiting for optimism to return sounds appealing too. We test both ideas against buying the S&P 500 every trading day, using identical contributions.
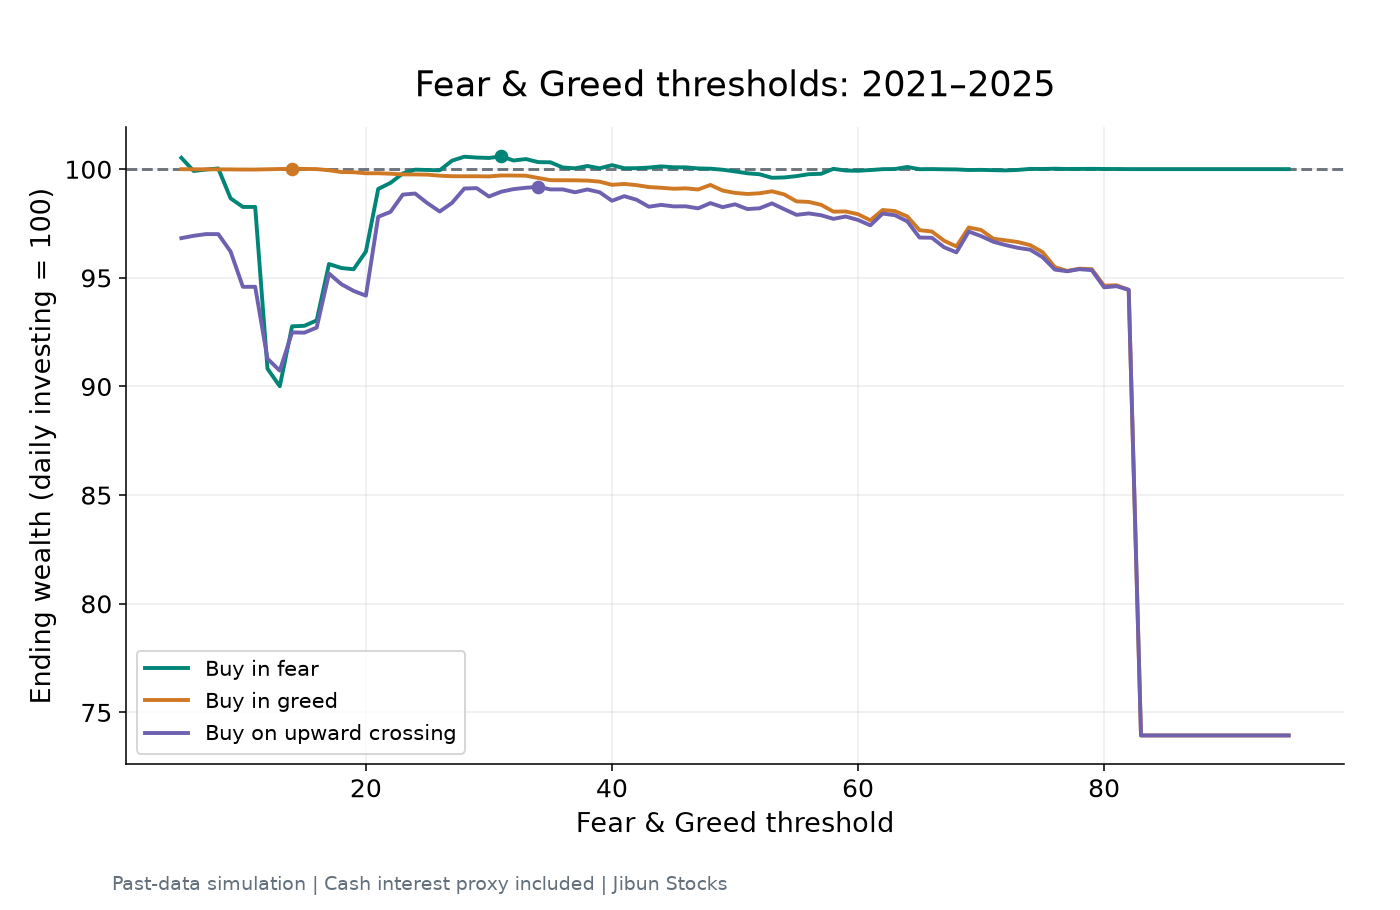
The central result is clear: sentiment helped describe market conditions, but it did not produce a compelling reason to suspend regular investing in this sample. The best full-period fear threshold, 31 or below, ended at 100.59 when daily investing equals 100—about 0.6% more wealth. Rules selected on the first part of the sample subsequently fell behind daily investing.
A stock-market sentiment gauge launched in 2012
CNN’s account of its development traces the index to CNNMoney’s efforts after the financial and European debt crises. Lex Haris and Paul R. La Monica’s team sought a broader risk-appetite gauge than the VIX alone. It launched in spring 2012.
The 0–100 scale runs from fear to greed. It combines momentum, stock-price strength, market breadth, put/call activity, VIX volatility, junk-bond demand and safe-haven demand. It measures behavior in market data rather than surveying how investors feel. It is distinct from the cryptocurrency index with the same name.
Recognizing fear is not the same as identifying tomorrow’s low. Falling prices and hedging demand can keep fear elevated during a continuing decline. Conversely, extended optimism can coincide with a profitable advance. These two properties create the tension between buying cheaper and spending too long out of the market.
Equal contributions, no sales and next-session execution
The study runs from February 2, 2021 to December 31, 2025: 1,235 SPY trading sessions. Each strategy receives $100 per session, for total contributions of $123,500. We model S&P 500 exposure using SPY dividend-adjusted closes, representing reinvested distributions. Daily investing finishes with $185,212.
Signal strategies accumulate new contributions in cash. On a qualifying day, they invest all waiting cash, including that day’s contribution. They never sell previously purchased shares. This is a test of when to invest incoming money, not a strategy that moves an existing portfolio in and out of stocks.
Signals use the previous trading day’s sentiment or VIX observation; purchases use the following session’s adjusted close. There is no same-close purchase based on that close’s signal. Waiting cash earns a simple calendar-day interest proxy using the TB3MS monthly three-month Treasury-bill discount yield lagged two calendar months, avoiding unpublished current-month averages. This is a cash-interest model, not an observed deposit-account or bond-ETF return. Taxes, commissions and currency changes are excluded; SPY operating costs already embedded in its price series are not deducted twice.
Three Fear & Greed rules
Fear: buy when the previous reading is at or below a threshold. Greed: buy when it is at or above a threshold. Both buy every qualifying day. Recovery: buy only after a crossing from below the threshold to at or above it. We test integer thresholds from 5 to 95. The vertical axis is ending wealth divided by daily-investing wealth, times 100. A reading of 105 means 5% more ending wealth from the same contributions, not a 5% annual return.
| Rule | Best threshold | Daily = 100 | Ending wealth | Buy days | Longest wait* |
|---|---|---|---|---|---|
| Buy in fear | ≤ 31 | 100.59 | $186,301 | 277 | 130 |
| Buy in greed | ≥ 14 | 100.01 | $185,235 | 1193 | 10 |
| Buy on recovery | ↑ 34 | 99.19 | $183,703 | 29 | 128 |
| Buy after VIX jumps | ≥ 2% | 100.08 | $185,359 | 401 | 19 |
The best fear threshold is 31, producing $186,301—approximately $1,089 more than daily investing. Moderate fear can concentrate accumulated contributions at lower prices. More extreme fear is not automatically better: a threshold of 10 produces 98.26. Rare signals leave cash waiting through market advances.
The best greed threshold is just 14, at 100.01, with purchases on 1,193 of 1,235 sessions. That is hardly a strategy of waiting for strong optimism: the optimum is close to investing every day. Recovery’s best threshold, 34, reaches 99.19. Waiting for a rebound to become visible did not fully recover the opportunity cost of waiting.
Simple fixed rules and the path of wealth
| Strategy | Signal | Daily = 100 | Ending wealth | Longest wait (sessions) |
|---|---|---|---|---|
| Daily investing | — | 100.00 | $185,212 | 0 |
| Buy in fear | FG ≤ 25 | 99.96 | $185,140 | 192 |
| Buy in greed | FG ≥ 75 | 96.18 | $178,132 | 332 |
| Buy on recovery | FG ↑ 50 | 98.38 | $182,214 | 99 |
| Buy after VIX jumps | VIX ≥ +10% | 98.95 | $183,263 | 107 |
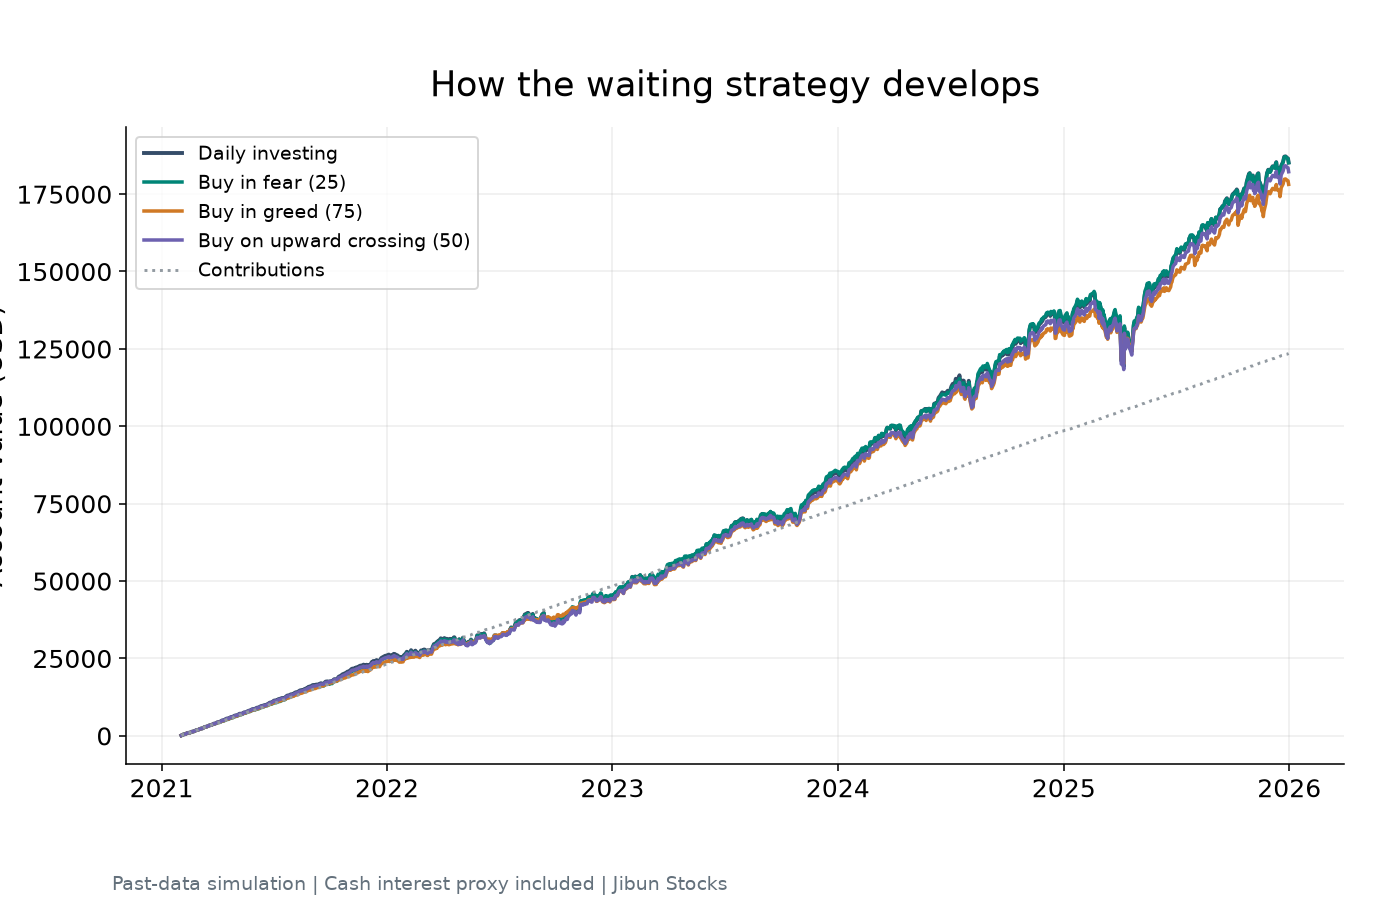
Buying at 25 or below ends at 99.96, almost identical to daily investing, but requires a maximum wait of 192 trading sessions. Buying at 75 or above ends at 96.18 and includes a 332-session wait. Buying after an upward crossing of 50 ends at 98.38. Accumulating cash makes individual purchases larger; it does not necessarily make final wealth larger.
A rule that helped in 2022 did not retain the same optimum
| Period | FG ≤ 25 | Best fear threshold | Best relative wealth | Buy days at optimum |
|---|---|---|---|---|
| 2021–2025 | 99.96 | 31 | 100.59 | 277 |
| 2022 | 103.78 | 16 | 106.06 | 17 |
| 2023–2025 | 99.21 | 5 | 100.21 | 2 |
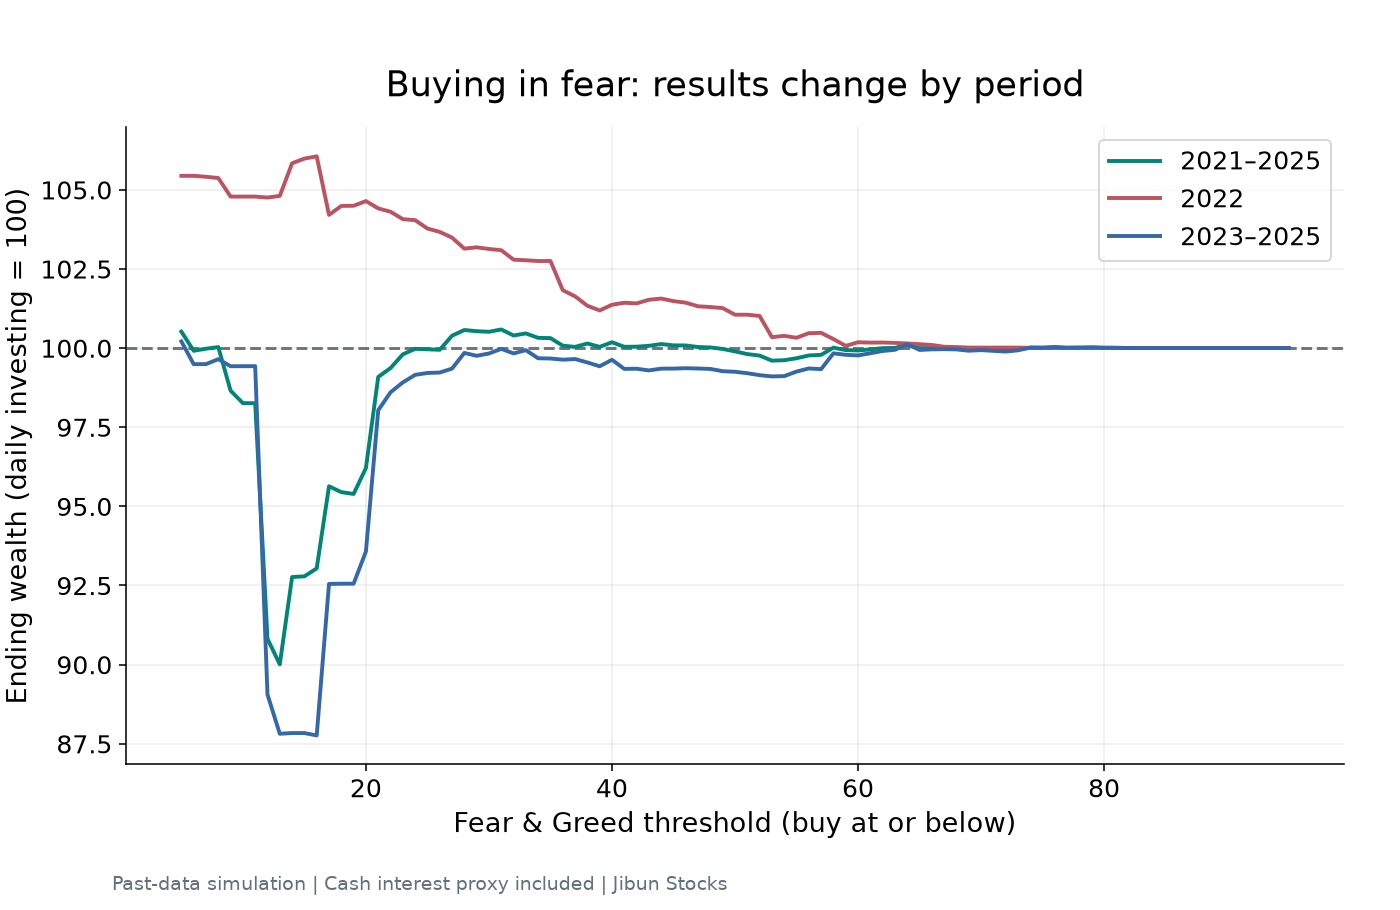
For 2022 alone, the best fear threshold is 16, reaching 106.06; the fixed threshold of 25 reaches 103.78. Holding cash during a falling market and deploying it at lower prices helped. But the best greed and recovery results that year occur at 76 with no stock purchases at all. VIX’s optimum, 25%, also makes no purchases. These results show cash beating stocks during a down year, not an indicator precisely discovering the bottom.
During 2023–2025, the fixed fear threshold of 25 produces 99.21. The fear optimum is 5, at 100.21, with only two purchase days and a maximum wait of 567 trading sessions. It benefits from a very particular path: cash builds for a long time before the extreme fear of 2025. The best threshold shifts from 31 over the full sample to 16 in 2022 and 5 in 2023–2025. An investor cannot choose the historical optimum using knowledge of the future market period.
Select on the earlier period, then evaluate separately
We select each rule’s best threshold using only 2021–2023, then keep it fixed for 2024–2025. The selected thresholds are fear 27, greed 13, recovery 38 and a VIX daily increase of 3%. The evaluation account starts from zero holdings and cash; only the rule transfers.
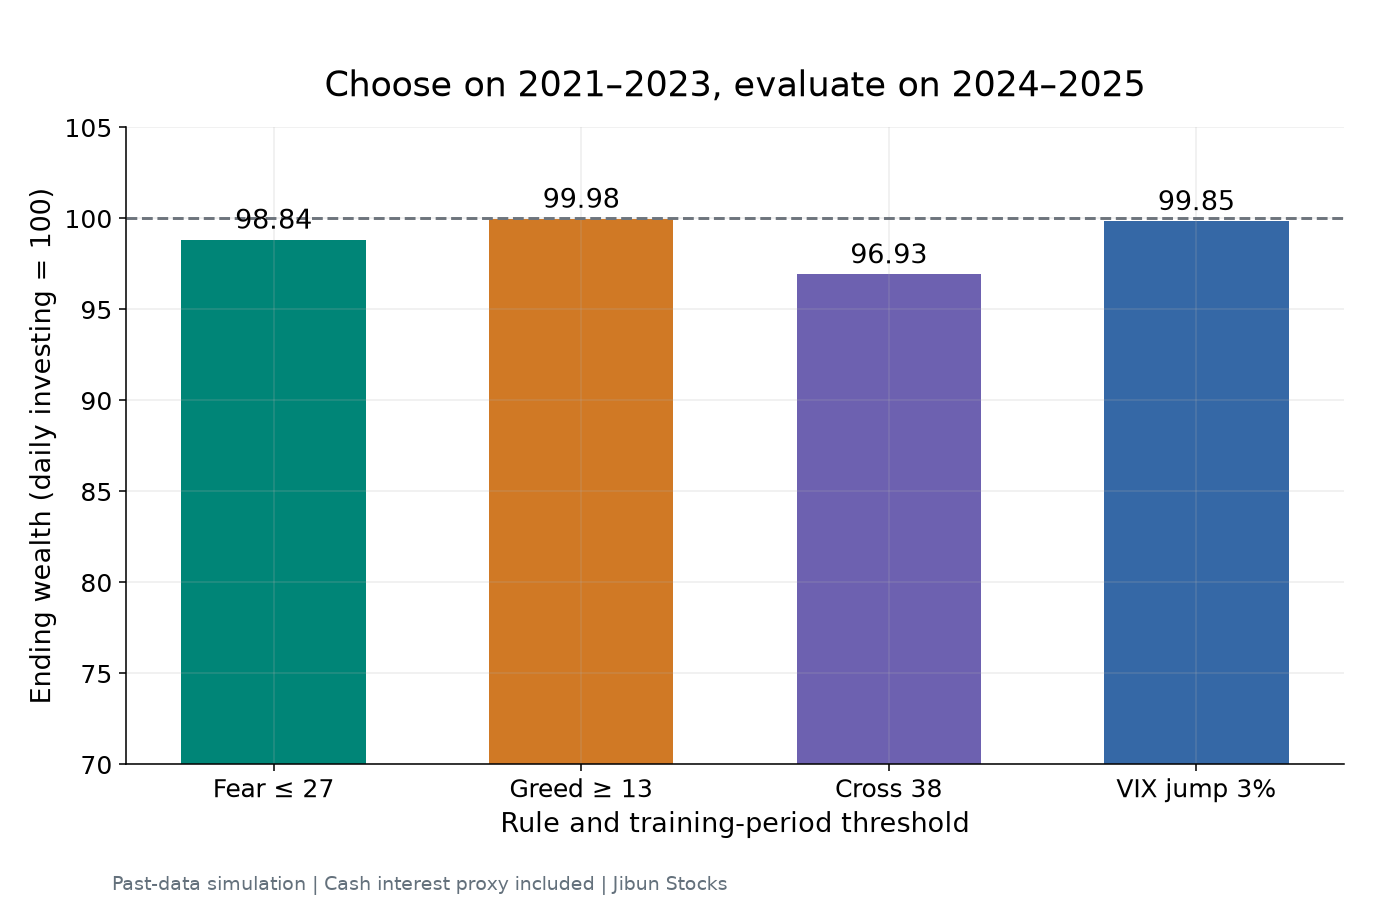
Later-period results are 98.84 for fear, 99.98 for greed, 96.93 for recovery and 99.85 for VIX. All trail daily investing. Optimizing the full chart identifies the threshold that best explains that historical period. Transferring an earlier selection tests whether the number travels well. In this exercise, the advantage needed to justify pausing regular purchases did not survive.
Use a VIX jump as the trigger
We also test the VIX’s daily percentage increase. A move from 20 to 22 is +10%; it is not a VIX level of 10. A qualifying previous-day increase triggers the following session’s cash deployment. Thresholds run from 0% to 50% in one-percentage-point steps.
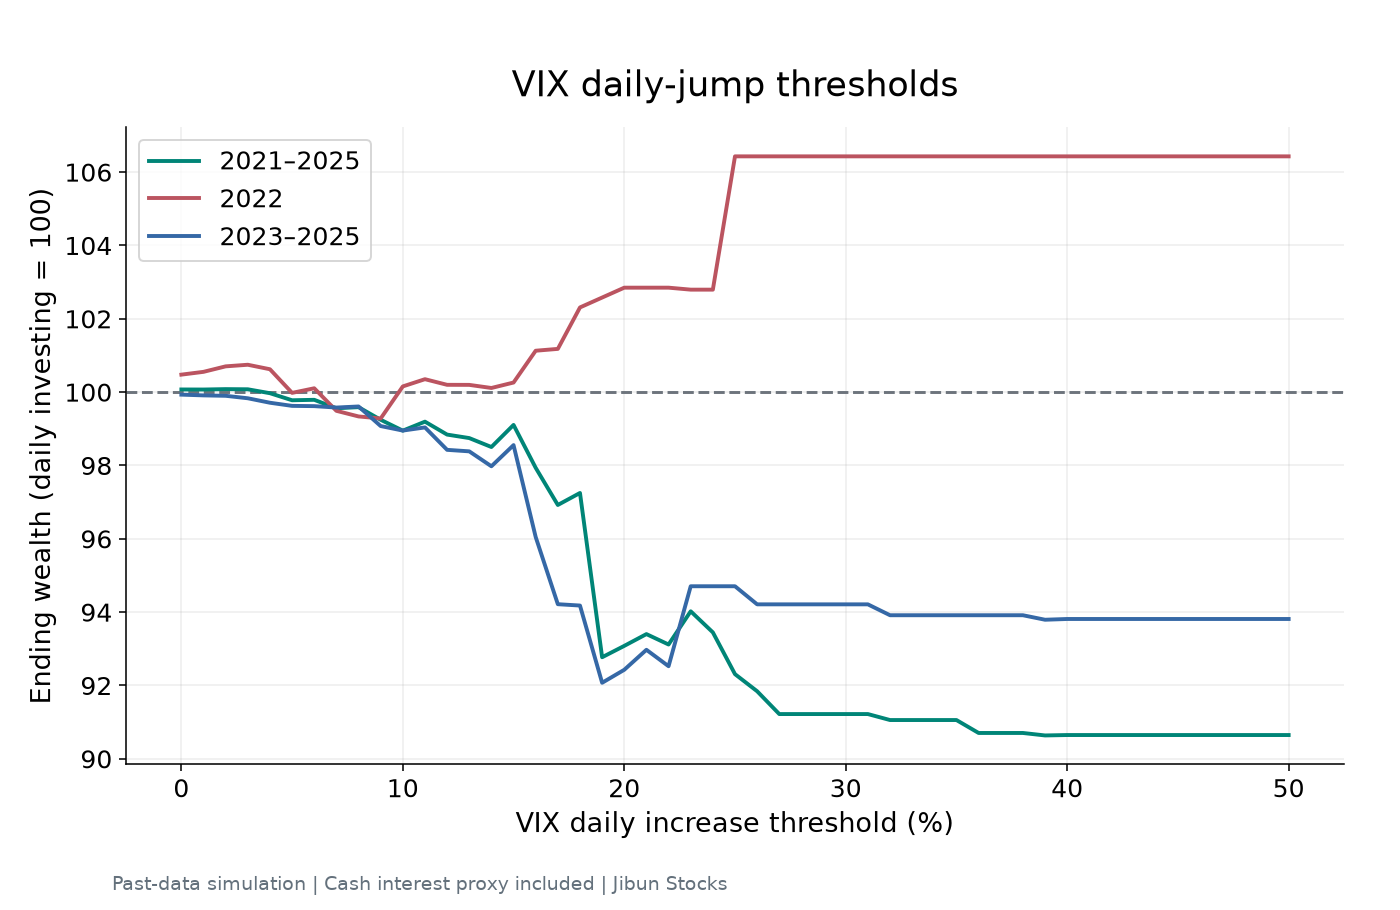
The full-period optimum is +2%, reaching 100.08. At +10%, the result is 98.95. Including small everyday increases moves the strategy closer to daily investing. Restricting purchases to dramatic spikes increases time spent holding cash. The indicator changes, but the trade-off remains.
Interest reduces the cost of waiting
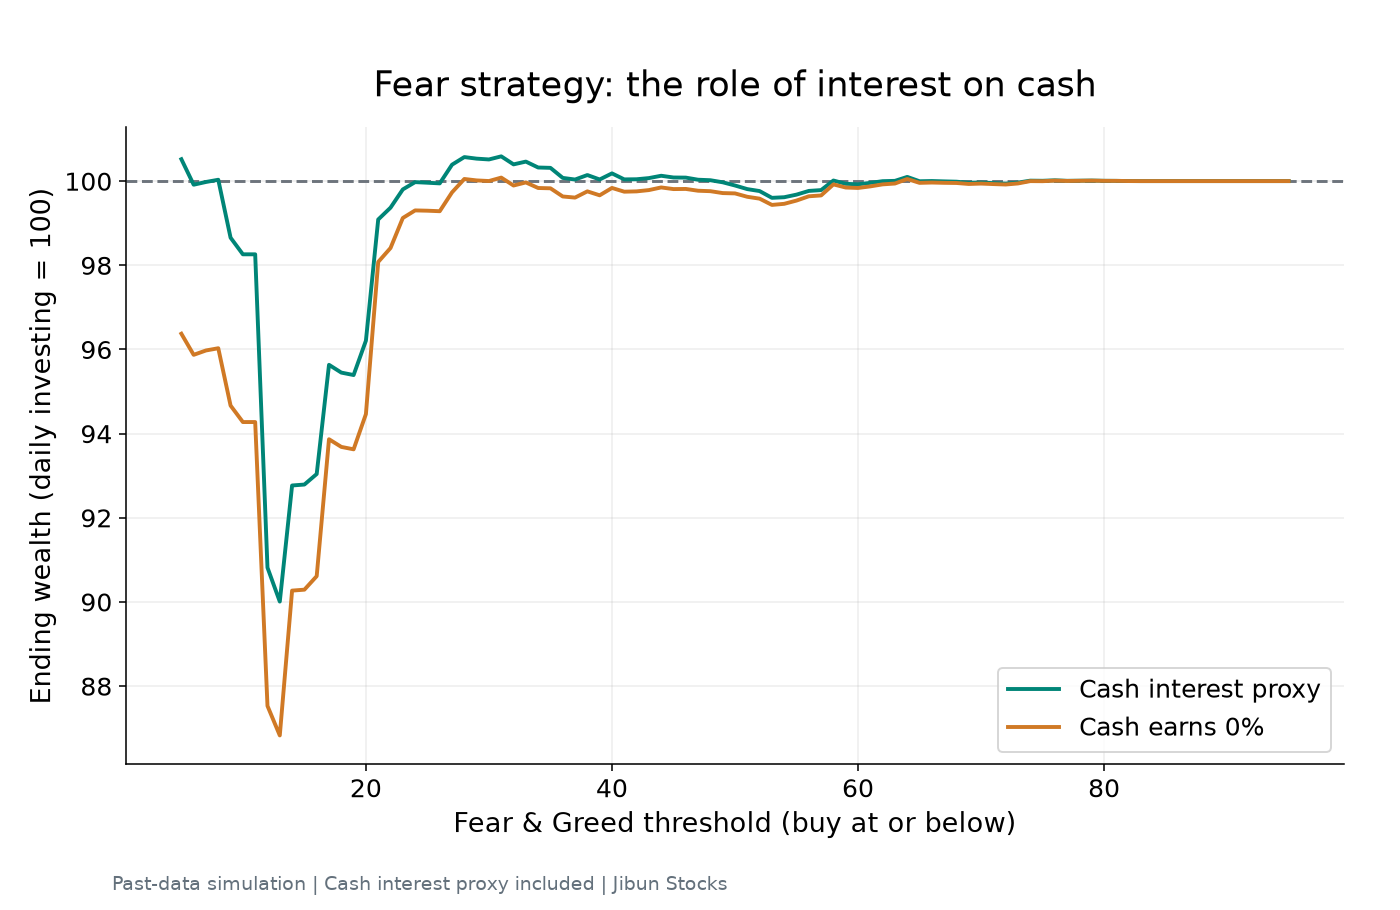
The same fear strategy is shown with modeled cash interest and with zero interest. Higher cash yields can cushion waiting costs. Even with that support, the full-period maximum is only about 0.6% above daily-investing wealth. Cash yield supports the strategy; it does not make an unusually strict sentiment signal a reliably superior purchase rule.
On this board, separate fear from the price response
Place the S&P 500, VIX and U.S. 10-year Treasury yield together, and consult CNN for the Fear & Greed reading. Start with how far stocks fall when the VIX rises. Then watch whether stocks stabilize while volatility remains elevated, or recover only after the VIX subsides. Intense fear and continued selling are separate observations.
Falling stocks alongside falling yields invite a closer look at growth concerns and risk aversion. Falling stocks alongside rising yields point toward inflation and discount-rate pressure. Comparing the drivers and price response explains more than treating one volatility reading as an automatic buy command.
The practical conclusion is to retain regular investing as the foundation and use sentiment as context. If it guides extra contributions, define a separate cash-allocation rule and evaluate that sleeve independently. Count the waiting period before a successful purchase, not just the appealing entry price. That distinguishes using fear constructively from letting fear run the investment process.
Data scope and reproducibility
Fear & Greed comes from a public archive of CNN-derived data, restricted to February 2021 onward. It is an analysis of the stored history available at retrieval, not a complete point-in-time record of every originally published intraday value. SPY adjusted closes come from Yahoo Finance, VIX closes from Cboe, and the cash-rate proxy from FRED’s TB3MS. There are no missing prior-session sentiment observations in the study window. All quoted optima are historical maxima within the tested grid, and ending cash is included.
Data and references
- CNN: Fear & Greed Index
- CNN Newsource: A brief history of the index (2025)
- Public archive of CNN-derived Fear & Greed history; February 2021 onward
- Yahoo Finance: SPY historical adjusted closes
- State Street: SPY investment objective and distributions
- Cboe: historical VIX closes
- Federal Reserve / FRED: TB3MS monthly Treasury-bill discount yields