Hold the same companies, change their weights, and change the outcome. The capitalization-weighted S&P 500 and equal-weight RSP show why allocation matters as much as stock selection. Which approach delivers better diversification?
Our May 2003–December 2025 calculation gives the S&P 500 an 11.38% CAGR against RSP’s 11.00%. Annual volatility is 18.72% versus 19.92%, and Sharpe ratios are 0.581 and 0.541. Cap weighting wins overall. Yet RSP has the higher Sharpe in 2003–2009, and both lower volatility and smaller losses in 2022. The difference is not a universal hierarchy; it is an allocation choice.
From Markowitz to Sharpe: the market portfolio
Markowitz’s 1952 portfolio-selection framework connects returns, variances and covariances. Diversification depends on how holdings move together, not simply how many there are. Sharpe’s 1964 CAPM connects portfolio choice to market equilibrium and gives the market portfolio a central role under its assumptions.
That theoretical market portfolio is not the S&P 500 alone. It contains all risky assets covered by the model in proportion to market value. With common expectations, frictionless trading and access to a risk-free asset, it is the tangency portfolio. This does not imply that an American large-cap index must have the highest realized Sharpe in every historical sample.
Expected efficiency and realized performance are different questions. Our test compares two observed weighting approaches; it does not establish the assumptions of CAPM.
An early indexing experiment used equal weights
A pioneering index portfolio was Wells Fargo’s approximately $6 million Samsonite pension mandate in 1971. FTSE Russell’s history describes an equal-weight approach to NYSE-listed stocks. High commissions and the trading required to maintain those weights became a problem, and the benchmark was later replaced by the capitalization-weighted S&P 500. Equal weighting belongs to indexing’s early history, not just its recent fashions.
The intuition persists among individuals. Benartzi and Thaler’s 2001 research documents some retirement savers dividing contributions equally across offered funds. But equal dollars across five overlapping funds are not equal weights across their underlying companies, and equal dollars never mean equal risk.
The same universe, different allocations
The regular S&P 500 weights by float-adjusted market capitalization. RSP, launched April 24, 2003, resets its S&P 500 company allocations roughly equally each quarter, near 0.2% per company. Its current expense ratio is 0.20%.
RSP increases exposure to the smaller companies within a large-cap universe; it is not a broad small-cap fund. Equal company weights also do not create equal sector weights. Sectors with more constituents receive more capital.
Both sides of this test include reinvested distributions: SP500TR is the S&P 500 total-return index, and RSP uses adjusted ETF closing prices. The index has no investment-product fee; RSP’s fund expenses are embedded in its prices. This is a benchmark-versus-investable-ETF comparison, not a fee-free index comparison.
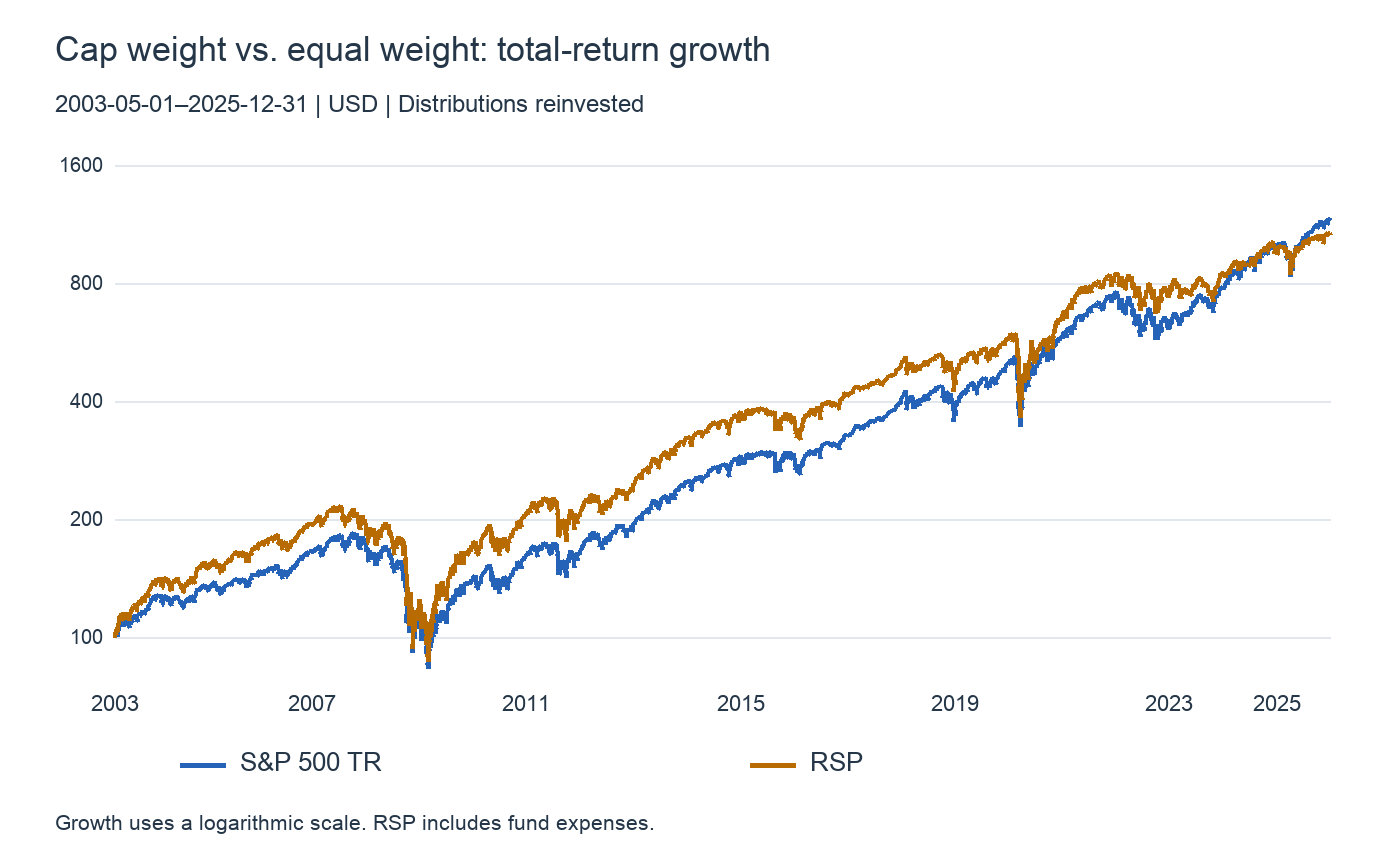
Nearly 23 years: equal weighting is not a low-risk shortcut
The common starting close is May 1, 2003, followed by 5,704 daily returns through December 31, 2025. Starting at 100, the S&P 500 finishes near 1,152 and RSP near 1,065. Both multiply capital more than tenfold, but cap weighting ends higher.
| Period | Allocation | CAGR | Annual risk | Sharpe | Max drawdown |
|---|---|---|---|---|---|
| 2003–2025 | S&P500 | 11.38% | 18.72% | 0.581 | -55.25% |
| RSP | 11.00% | 19.92% | 0.541 | -59.92% | |
| 2003–2009 | S&P500 | 5.07% | 21.69% | 0.227 | -55.25% |
| RSP | 8.20% | 23.83% | 0.350 | -59.92% | |
| 2010–2019 | S&P500 | 13.56% | 14.77% | 0.899 | -19.36% |
| RSP | 13.11% | 15.66% | 0.831 | -22.88% | |
| 2020–2025 | S&P500 | 15.07% | 20.92% | 0.647 | -33.79% |
| RSP | 10.67% | 21.43% | 0.454 | -39.04% | |
| 2022 | S&P500 | -18.17% | 24.18% | -0.779 | -24.49% |
| RSP | -11.65% | 22.75% | -0.506 | -21.38% | |
| 2023–2025 | S&P500 | 22.98% | 15.06% | 1.142 | -18.75% |
| RSP | 12.55% | 14.46% | 0.566 | -17.81% |
RSP’s full-sample volatility is approximately 1.20 percentage points higher. Maximum drawdown is −59.92%, against −55.25% for the S&P 500. Reducing single-company concentration does not necessarily reduce portfolio volatility. Greater exposure to economically sensitive businesses can increase shared cyclical risk.
In 2003–2009, however, RSP compounds at 8.20%, compared with 5.07% for the S&P 500. It takes more risk but achieves a higher Sharpe, 0.350 versus 0.227. Higher volatility alone is not evidence of inefficiency: the return earned for that risk matters.
When the rest of the market catches up
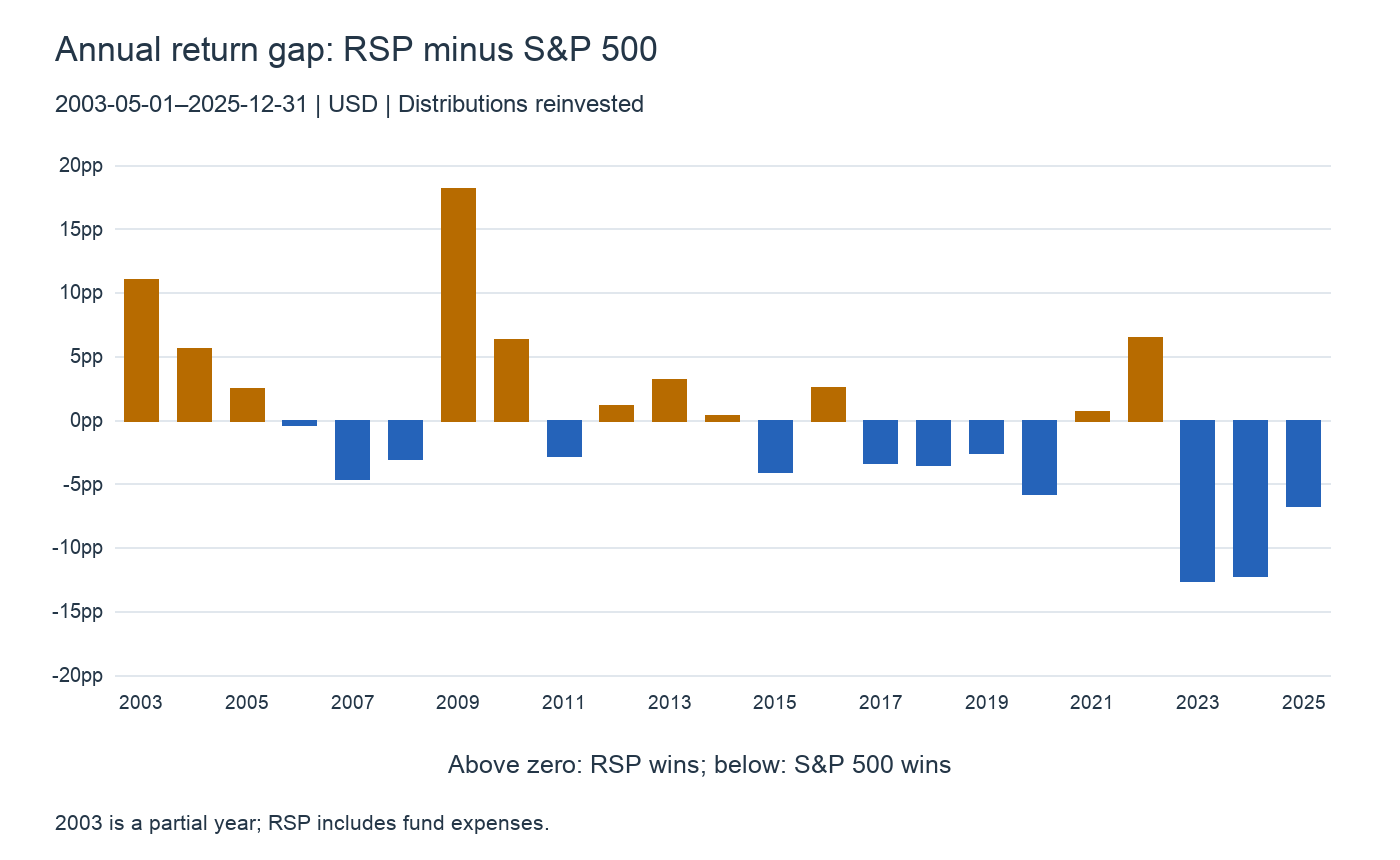
In 2009 RSP returns 44.61%, versus 26.46% for the S&P 500. Its tilt toward relatively smaller constituents participates strongly in the recovery. The previous year tells the other half of that story: RSP loses 40.06% in 2008, against 37.00%. Rebound strength and crisis protection are not the same characteristic.
In 2023–2025 the S&P 500 compounds at 22.98%, compared with RSP’s 12.55%. RSP actually has slightly lower volatility, 14.46% versus 15.06%, but its Sharpe is 0.566 rather than 1.142. It loses this comparison because its allocation earns substantially less, not because it is more volatile. My interpretation is that cap weighting captured more of mega-cap growth leadership.
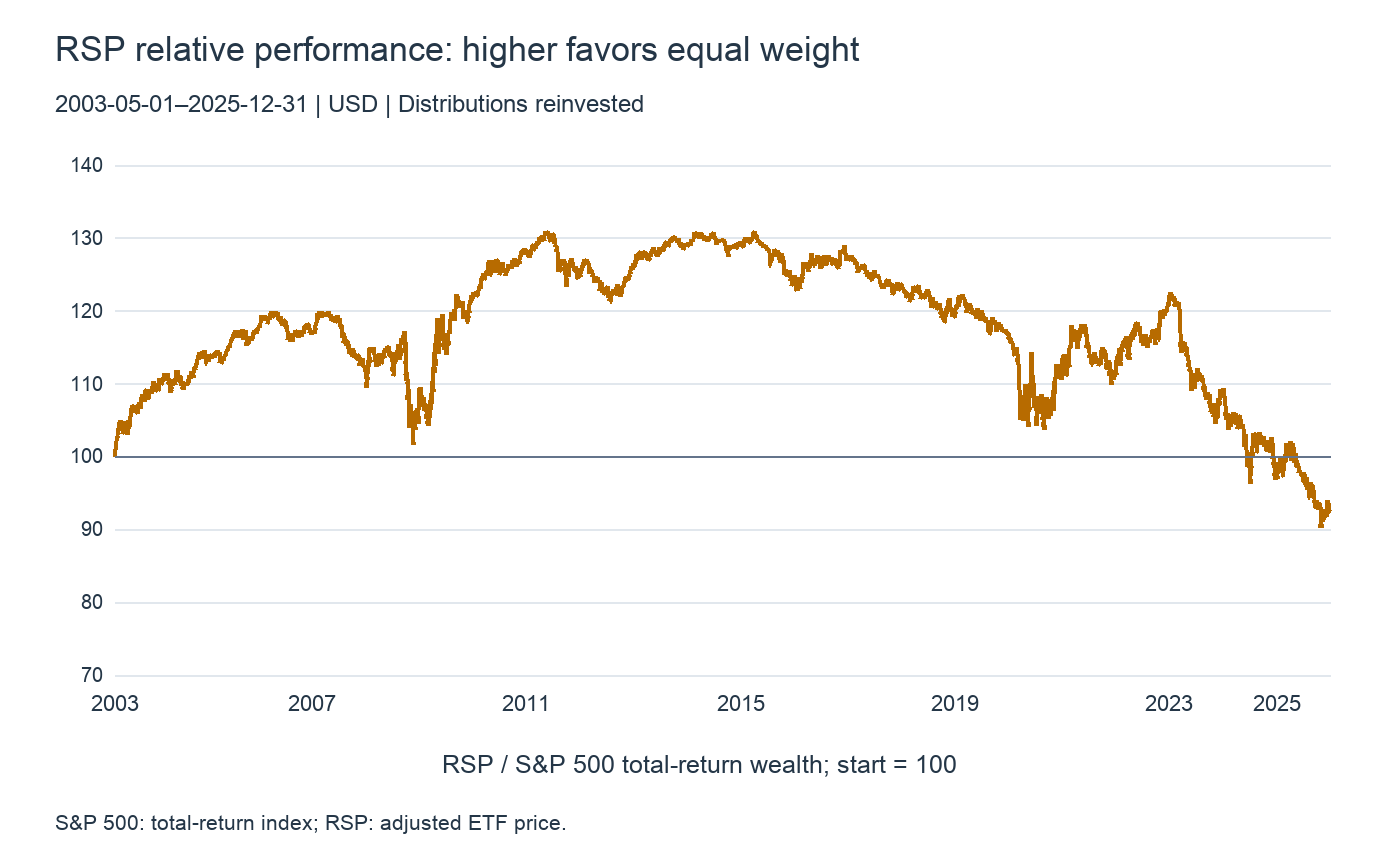
An upward relative line favors RSP; a downward line favors the S&P 500. The extended decline after the early part of the sample illustrates the opportunity cost of reducing mega-cap weights during their leadership. Full-sample daily-return correlation is 0.964. Similar daily directions still allow meaningful long-run gaps.
Size, value and rebalancing are investment choices
S&P Dow Jones Indices research examines size, value and anti-momentum characteristics behind equal weighting. Quarterly resets trim relative winners and add to relative losers. Reversals can favor this discipline; persistent leadership can work against it.
I view equal weighting not as a purer version of the market, but as a systematic decision to reduce giant-company exposure and allocate more to the rest. Its recovery potential and its opportunity cost are two sides of that decision.
What about bubbles?
If an overvalued company becomes dominant, cap weighting amplifies exposure to its eventual disappointment. Equal weighting limits that concentration. But a company can also grow because its business succeeds. Reducing its weight then means reducing exposure to genuine success. Large market value is not, by itself, evidence of overvaluation.
Cap weighting does not require buying more shares every time a stock rises: an existing holding’s value and portfolio weight rise together. Equal weighting requires trades to restore fixed weights. Concentration control therefore comes with rebalancing costs, an operational distinction dating back to indexing’s early experiments.
2022: equal weighting does not always carry more risk
Calendar-year returns in 2022 are −18.11% for the S&P 500 and −11.62% for RSP. Annual volatility is 24.18% versus 22.75%, and period drawdowns are −24.49% versus −21.38%. My reading is that reducing large-growth exposure provided protection in that particular environment.
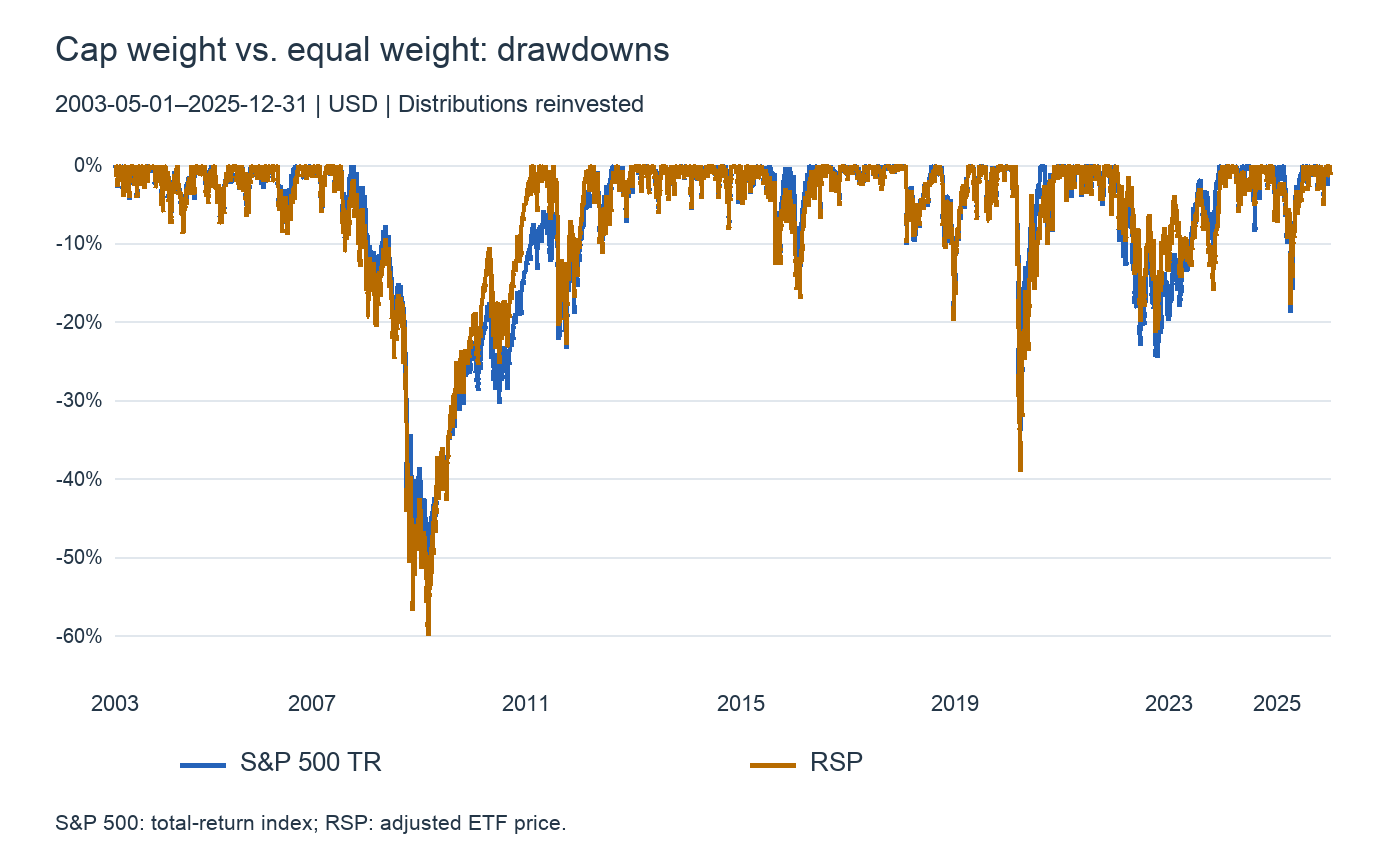
“Off the efficient frontier” does not mean “necessarily more volatile.” It means another allocation provides greater expected return at the same risk, or less risk at the same expected return. Portfolio variance depends on weights and covariances. Lower concentration can reduce volatility in some periods without proving universal efficiency.
Expected returns and covariances must also be estimated. DeMiguel and colleagues’ 2009 study finds that several estimation-based optimizers do not consistently outperform 1/N out of sample. That is not proof that RSP always wins; it is evidence that simple rules can avoid costly estimation errors.
Use this board to read the gap
Place S&P 500 and RSP side by side and compare their daily percentages. A stronger S&P 500 highlights the influence of larger companies. Strength reaching RSP invites a closer look at participation beyond the giants; it does not establish that every stock rose.
Add MAGS for three views: the giant seven, broad U.S. large caps, and equal-weight large caps. Strong MAGS and S&P 500 with weak RSP indicate concentrated leadership; RSP catching up invites investigation of a broader rally. Track whether the gap opens at the start, after news or into the close.
Compare percentage changes over shared session hours, not pixel slopes or nominal prices. The board’s regular S&P 500 chart is an intraday price index; this long-run analysis includes dividends. The two tools answer different questions.
My conclusion: cap weight as the foundation, equal weight as a tilt
For a U.S. large-cap foundation, I favor low-cost capitalization weighting. It wins the full-sample return, volatility and Sharpe comparison and requires less weight-reset trading. RSP is a deliberate way to reduce mega-cap concentration, not automatically a safer stock portfolio.
Equal weighting wins some eras and offers protection in some years, but its crisis drawdown approaches 60%. Changing stock weights does not replace diversification into cash, bonds or other assets. RSP changes the composition of equity risk; it does not remove equity risk.
Data and calculation
The common period runs May 1, 2003–December 31, 2025. Yahoo Finance SP500TR provides the dividend-inclusive S&P 500 index; RSP adjusted closes reflect reinvested distributions. Only common observation dates are used, without invented missing values. CAGR uses actual elapsed calendar time; annual risk is the sample daily-return standard deviation multiplied by √252.
Sharpe is mean daily excess return divided by its sample standard deviation, multiplied by √252. The risk-free proxy uses the previous month’s FRED TB3MS three-month Treasury bill rate, scaled by calendar days between sessions divided by 365. Drawdowns include the starting value; each era begins from its preceding close. 2003 is a partial year. Annual bars show cumulative calendar-year returns, while table CAGR uses elapsed calendar time. Personal taxes, currency effects and trading commissions are excluded; RSP fund expenses are already reflected. Calculated October 13, 2026.
Data and references
- Nobel Prize — Markowitz, Sharpe and portfolio theory
- Sharpe (1964) — Capital Asset Prices
- FTSE Russell — Early equal-weight indexing and Samsonite
- Benartzi & Thaler (2001) — Naive diversification
- DeMiguel, Garlappi & Uppal (2009) — Optimal versus naive diversification
- S&P DJI — S&P 500 overview
- S&P DJI — Worth the Weight
- Invesco — RSP fund details
- Yahoo Finance — S&P 500 total-return history
- Yahoo Finance — RSP historical prices
- FRED — TB3MS risk-free proxy