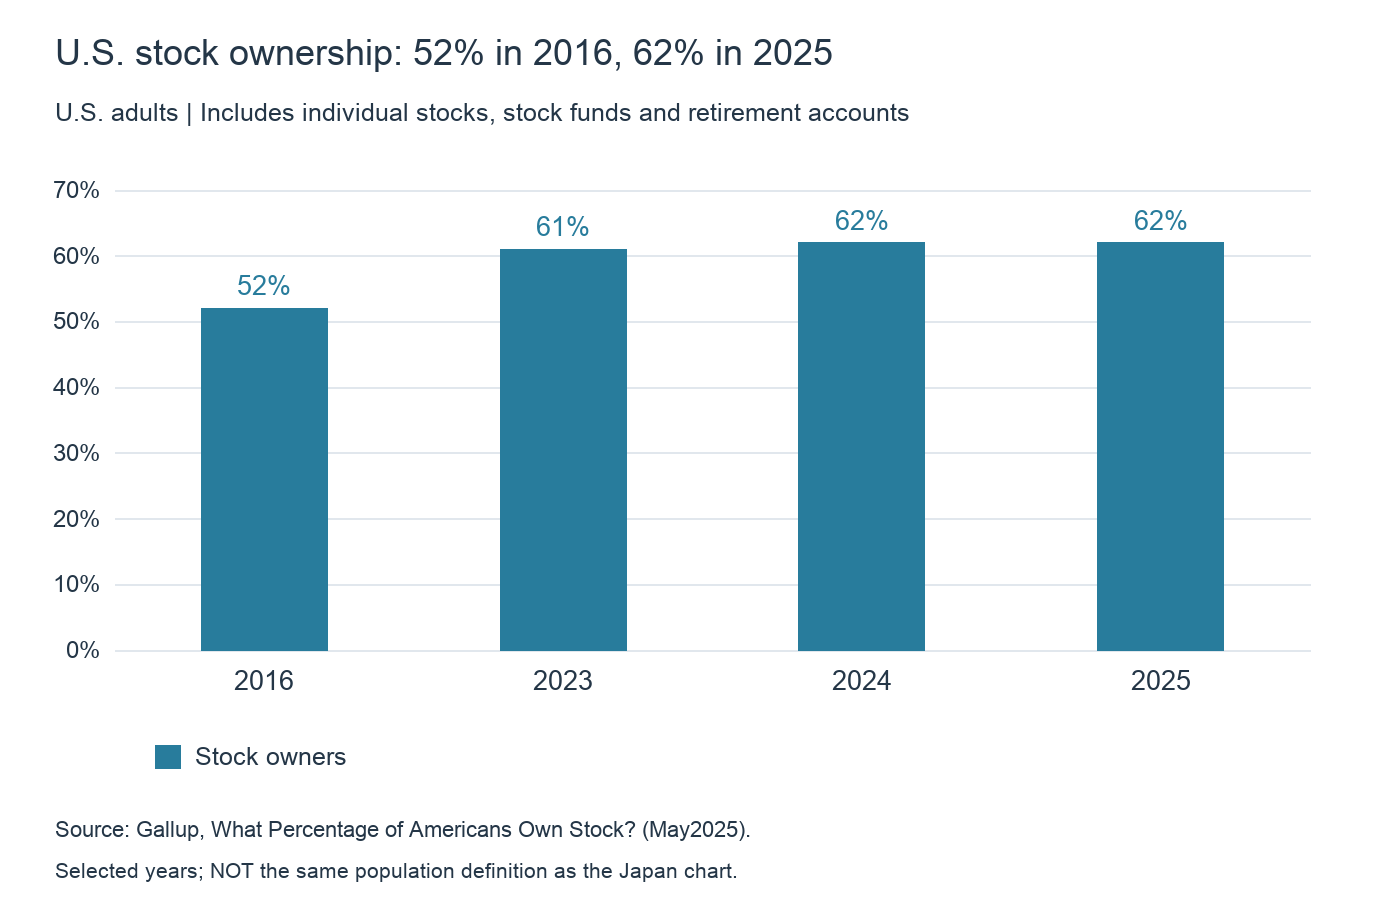
Stocks and funds have become more accessible through tax-advantaged accounts and online brokers. In the U.S., stock ownership recovered from 52% of adults in 2016 to 62% in 2025. Growth attracts attention; the people who stop investing are less visible. How many are there? Gallup’s ownership survey
A recent Japanese survey offers a concrete answer to a clearly defined question. Of 4,603 respondents who had ever held stocks or investment funds,559 held neither at the time of the survey: 12.1%, approximately one in eight. This is a snapshot of former ownership, not an annual bankruptcy or permanent-exit probability.
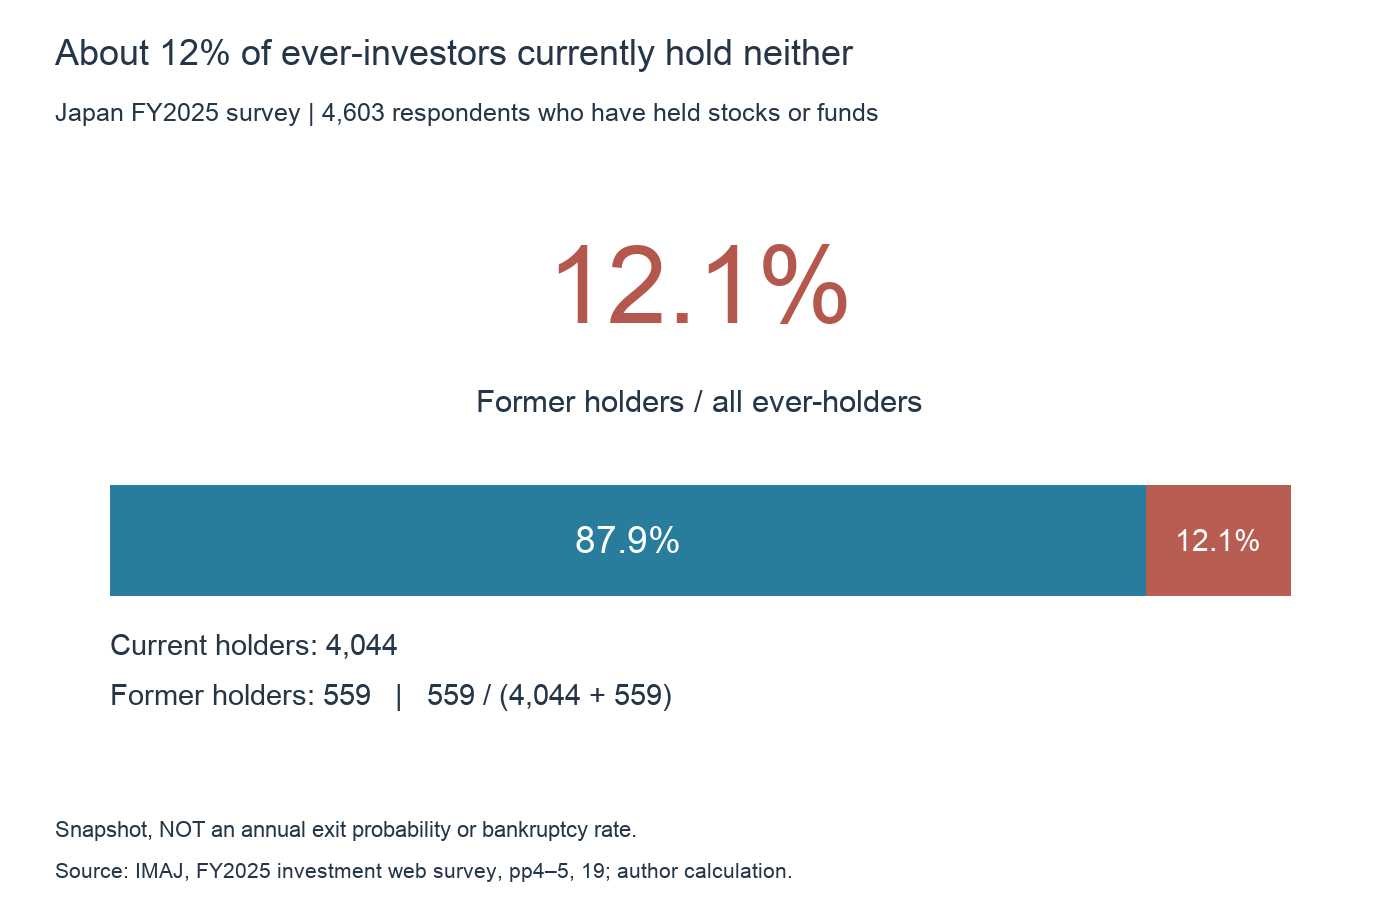
The FY 2025 study surveyed 10,000 Japanese adults aged 20–69 on January 21–26,2026. Former holders represented 5.59% of all respondents. To answer the question among people who had actually participated, we calculate 559 divided by 4,044 current holders plus 559 former holders. Funds and individual stocks are treated together here as investment participation. IMAJ survey, pp 4–5 and 19
Participation expanded, but not every year
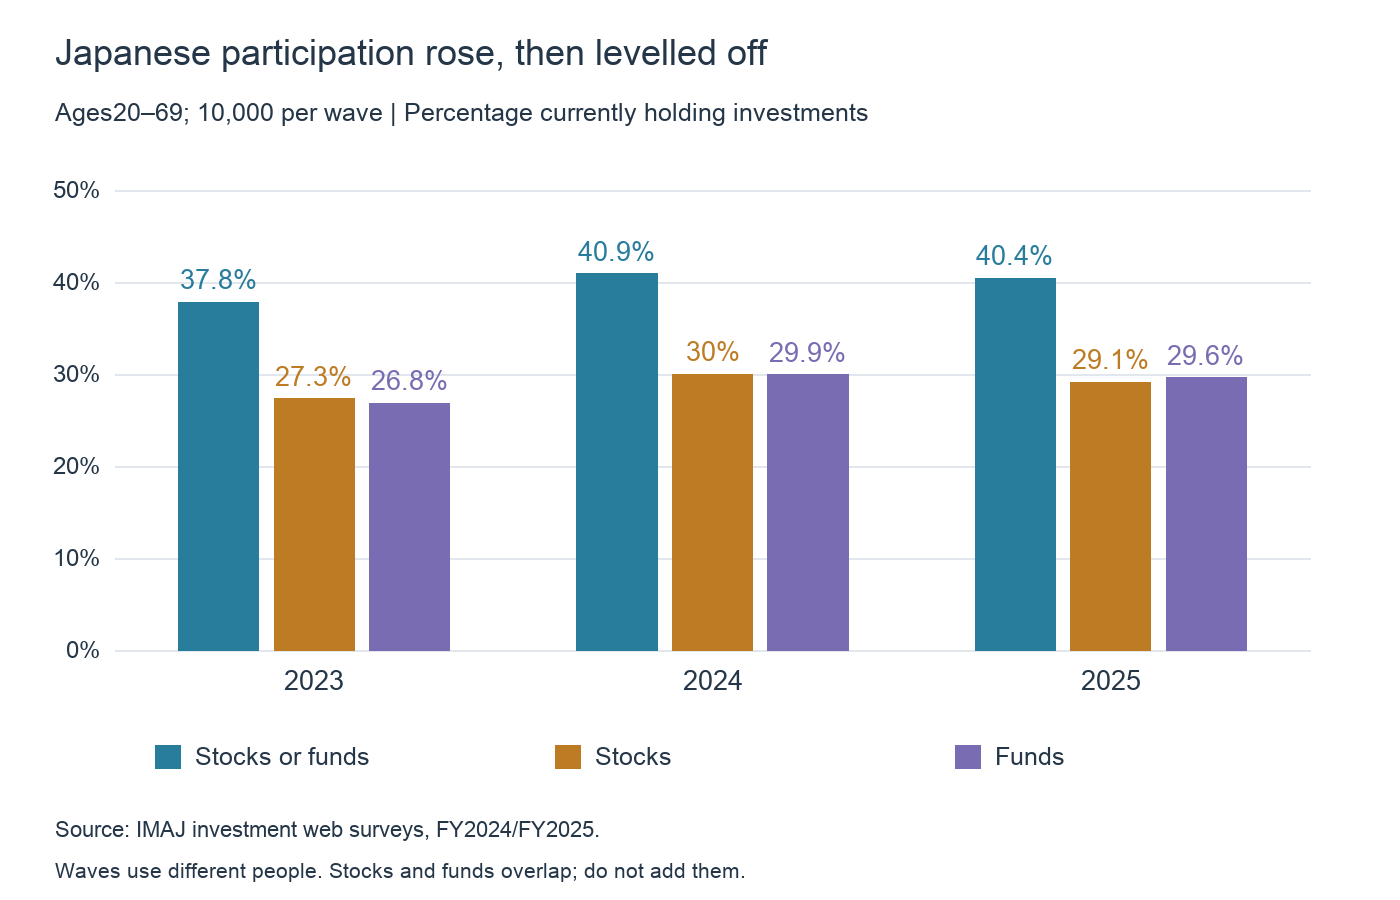
In Japan’s survey series, current ownership of stocks or funds was 37.8% inFY 2023,40.9% inFY 2024 and 40.4% inFY 2025. Participation expanded around the first year of the new NISA system, then levelled off. Stock and fund ownership overlap; adding their separate percentages would double-count some people. FY 2024 report / FY 2025 report
Gallup counts U.S. stock ownership through individual shares, stock funds and retirement accounts such as 401(k)s and IRAs. Its figures were 52% in 2016,61% in 2023 and 62% in both 2024 and 2025. Long-run expansion and recent stability coexist. Different age coverage and ownership definitions prevent a simple Japan-versus-U.S. ranking of enthusiasm. Gallup’s definition and history
Another U.S. measure, FINRA Foundation’s NFCS, finds that adults holding stocks, bonds, funds or other securities outside retirement accounts rose from 30% in 2015 to 32% in 2018 and 35% in 2021, then stood at 34% in 2024. This excludes retirement accounts but includes securities other than stocks. Different measures should remain separate rather than being spliced into a single trend. 2024 NFCS findings, p 3
More investors can coexist with substantial departures
Imagine 100 people entering while 30 leave. Participation increases by 70, but that net increase does not make the 30 departures disappear. The same distinction applies to rising account totals and ownership rates.
Success stories and surveys of current investors can also lose sight of people who stopped. Those still investing are available to report their experience; former participants are absent unless researchers deliberately include them. That is the survivorship problem this article addresses.
Current non-ownership does not necessarily mean financial failure. A person may have lost money, sold to fund a home purchase, taken profits or paused temporarily. The 12.1% Japanese figure does not establish bankruptcy or lifelong withdrawal. Observed non-ownership and investment failure are different outcomes.
A U.S. follow-up: three quarters of new investors maintained the account
Researchers from FINRA Foundation, NORC and the SEC revisited people who opened taxable accounts in early 2020. By 2022,75.2% of first-time investors and 88.6% of experienced investors maintained the relevant account. The follow-up included 480 of the original 737 respondents, a 65.1% retention rate. Follow-up study, pp 1 and 9
| 2020 account openers | Account maintained in 2022 | Do not know if still open |
|---|---|---|
| New investors | 75.2% | 15.6% |
| Experienced investors | 88.6% | 4.7% |
It would be wrong to call the remaining 24.8% of new investors market dropouts.15.6% did not know whether the account remained open. Closing one account also need not mean abandoning other brokerage or retirement investments. The table does not reveal the status of nonrespondents.
Japan’s snapshot and this U.S. account follow-up therefore do not measure a common national exit rate. The useful findings are that many beginners stayed through the following two years, while continued account ownership was less often confirmed among beginners than experienced participants.
Why stop? Cash needs and fatigue matter alongside losses
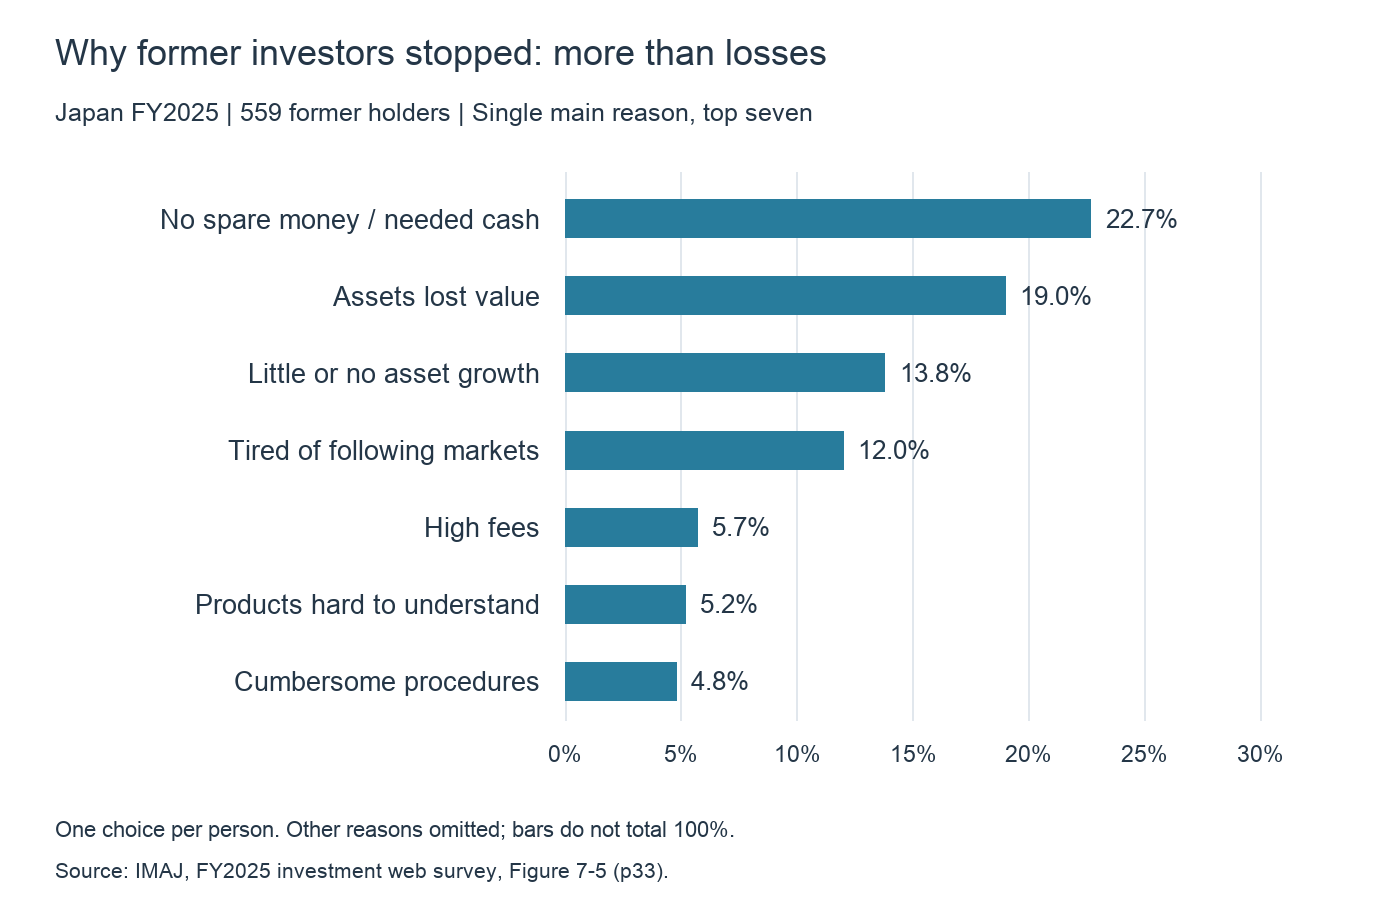
Among 559 Japanese former holders, the single most important reason was lack of investable money or a need for cash 22.7%, followed by asset losses 19.0%, little growth 13.8% and fatigue from following daily markets 12.0%. These are first-ranked responses, not a multiple-choice total. FY 2025 survey, Figure 7-5, p 33
That pattern suggests a broader response than improving stop-loss technique. Investing money needed for living costs can force liquidation at an awkward time. Constant monitoring can make an otherwise reasonable allocation exhausting. Unrealistic expectations of steady gains can turn an ordinary flat period into disappointment.
Separate spending reserves, avoid dependence on borrowing or leverage, do not turn an expected long-run return into a monthly quota, and choose how often to check. These are conditions for sustainability, not stock-picking tricks. Necessary withdrawals are not a moral failure: investing should support life, not subordinate it to a portfolio.
How much experience do current investors have?
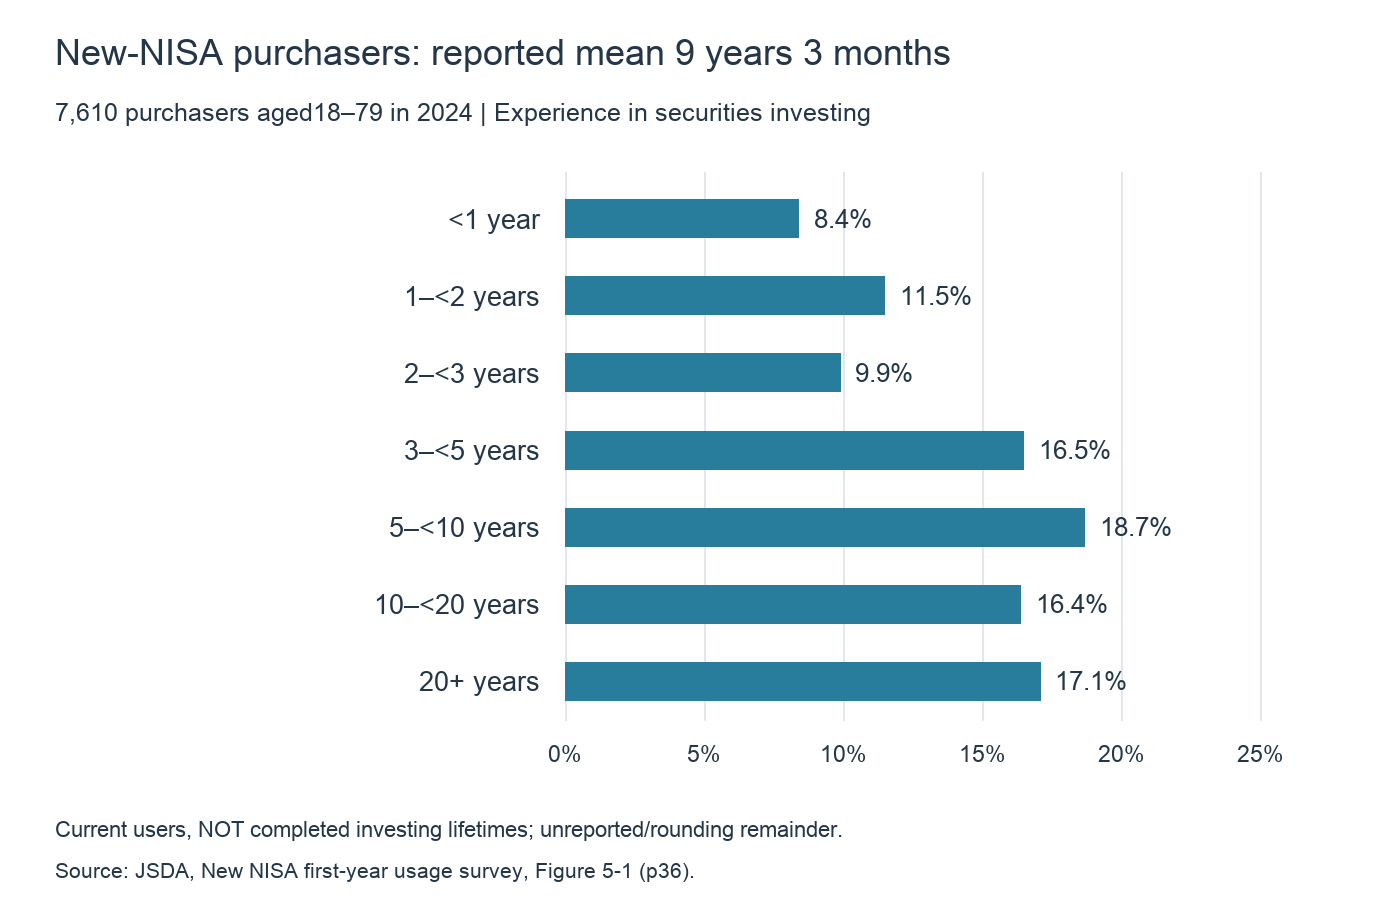
A JSDA study of 7,610 adults aged 18–79 who purchased investments in the new NISA during 2024 reports a mean securities-investing experience of 9 years 3 months. The distribution spans beginners and people with 20 or more years. This is a specific group of purchasers, not all Japanese investors. New-NISA usage study, Figure 5-1
Among 2,861 respondents to the 2024 U.S. NFCS Investor Survey,8% started non-retirement investing under two years earlier,38% between two and ten years earlier, and 52% ten or more years earlier. The median therefore lies in the 10+ category. Assigning an arbitrary 15 or 20 years to that open-ended category would manufacture a mean rather than measure one. FINRA Foundation, pp 2 and 4
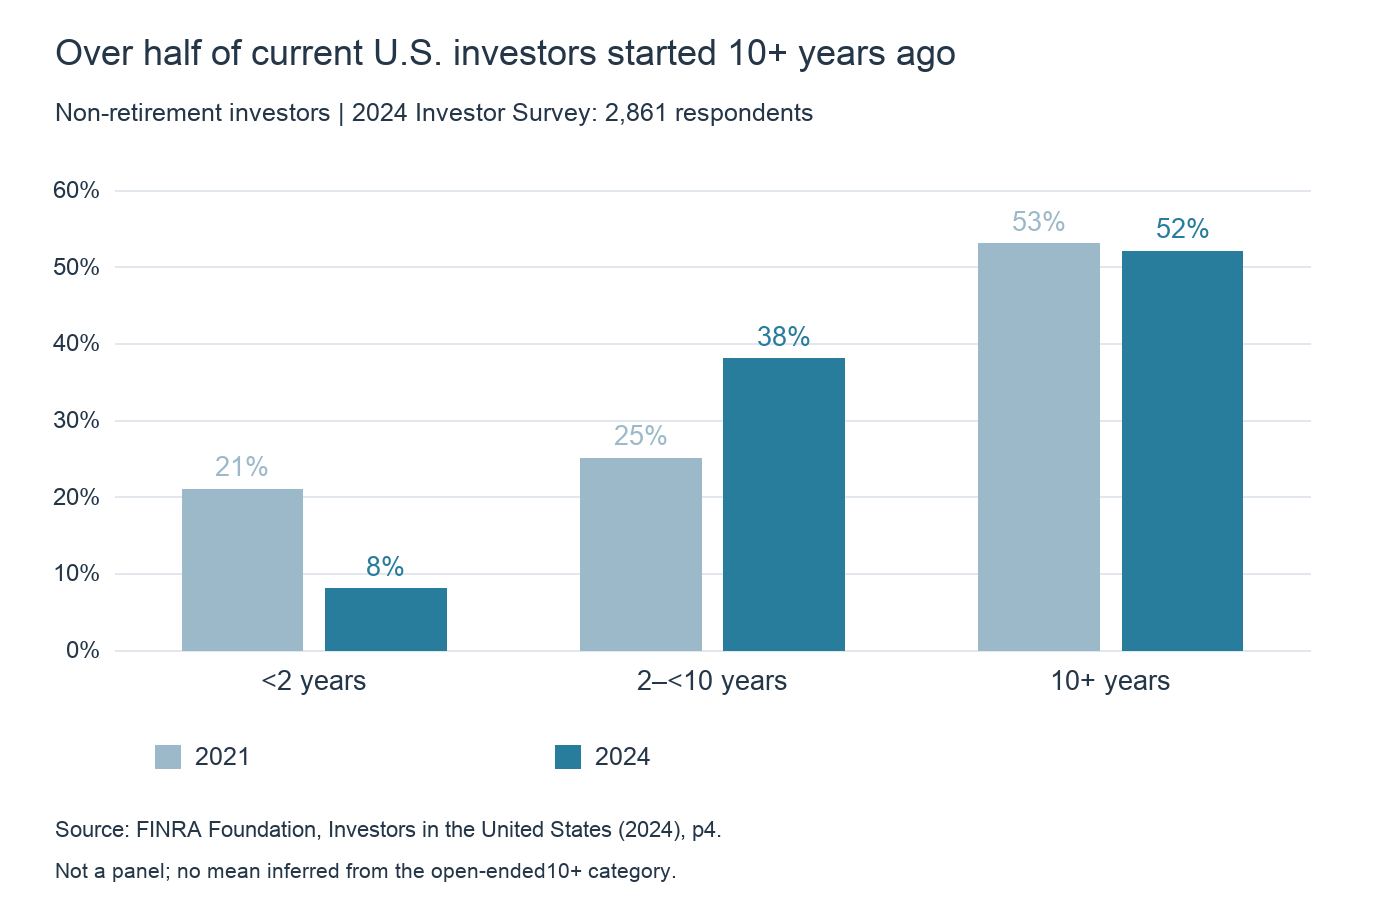
Current investors’ experience is not their completed investing lifetime. The final duration of an ongoing participant is not known; former participants are missing from a current-investor-only sample. A 9-year mean does not predict withdrawal in year nine. Nor does a majority of current investors having 10+ years establish that half of all entrants survive ten years.
A genuine duration estimate needs entrants followed over time, with pauses, restarts, transfers, deaths and departures distinguished. The available figures describe participation and present experience. Keeping their meaning intact is more informative than repeating an unsupported claim that 90% of investors disappear.
Use this board to slow down on volatile days
Place the S&P 500 or Nikkei 225 beside the VIX when markets become unsettled. The VIX represents roughly 30-day expected S&P 500 volatility inferred from options. It is not a direct Japanese-equity volatility index. Compare the size of the equity decline with the level of U.S. market stress before deciding whether a trade is needed. Cboe’s explanation
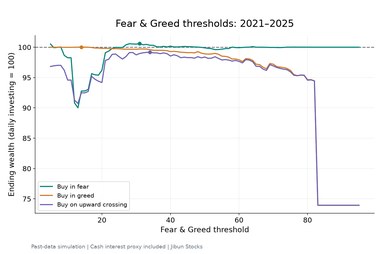
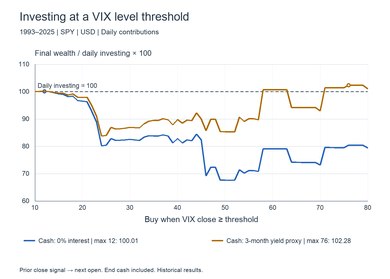
Our VIX timing study and Fear & Greed study examine purchases during fearful conditions. A decline also lets a planned contribution buy more units. Some sharp selloffs are followed by short-term rebounds; selling everything solely because the screen looks frightening removes participation in that recovery too.
High fear is not proof of a bottom. Our earlier tests include a falling period in which waiting for fear helped, and later periods where transferred thresholds did not beat regular purchases. A potential opportunity is not a reliable timing signal. Decide whether to maintain contributions or add a separately budgeted amount within rules made before the turbulence.
If daily observation itself causes fatigue, check less often. A dashboard need not generate more orders. It can also demonstrate that a large move does not require an immediate response.
Staying invested is a design problem, not permanent optimism
The surveys point to cash constraints, losses, disappointment and fatigue. Willpower alone does not solve them. Protect spending money, limit the amount exposed to volatility and reduce unnecessary monitoring and trading.
Continuing to invest does not require retaining every unsuitable product forever. A portfolio can change while participation continues. Rather than copying an uninterrupted success story, build a position in which a drawdown does not break your finances or your ability to make decisions.
Data and references
- IMAJ — FY2025 Investment Web Survey (January2026; pp4–5,19,33)
- IMAJ — FY2024 Investment Web Survey (January–February2025)
- Gallup — What Percentage of Americans Own Stock? (May2025)
- FINRA Foundation/NORC et al. — Where Are They Now? (March2023; pp1,9)
- JSDA — New-NISA First-Year Usage Survey (May2025; pp6,36)
- FINRA Foundation — Investors in the United States,2024 survey (December2025; pp2–4)
- Cboe — VIX definition and methodology