Japanese households invest through NISA funds, while many U.S. families own stock funds through retirement accounts. Participation extends well beyond people trading individual shares. Japanese survey ownership of stocks or investment funds rose from 37.8% in FY2023 to 40.4% in FY2025. Gallup’s U.S. stock-ownership measure, including retirement accounts, rose from 52% in 2016 to 62% in 2025. The surveys cover different populations, but both document broader participation. Our study of participation and investor exits
Where does the rest of the household balance sheet sit? Japan holds substantially more cash and deposits; U.S. financial wealth is more exposed to equities. We examine central-bank allocations and calculate how aggregate financial assets changed from 2000 to 2025, before and after inflation.
What an “average household portfolio” actually measures
Our main allocation is the composition of all financial assets held by the household sector: deposits, securities, investment funds and insurance or pension claims. It excludes homes and land and does not subtract mortgages or other liabilities. Financial assets are not total assets or net worth.
This is also an asset-weighted national allocation, not an equal-weighted average of each family’s percentages. Wealthier families have more influence. A large national equity share does not mean that the median family holds that share. National aggregates are useful for understanding exposure, but they are not a model allocation every household should copy.
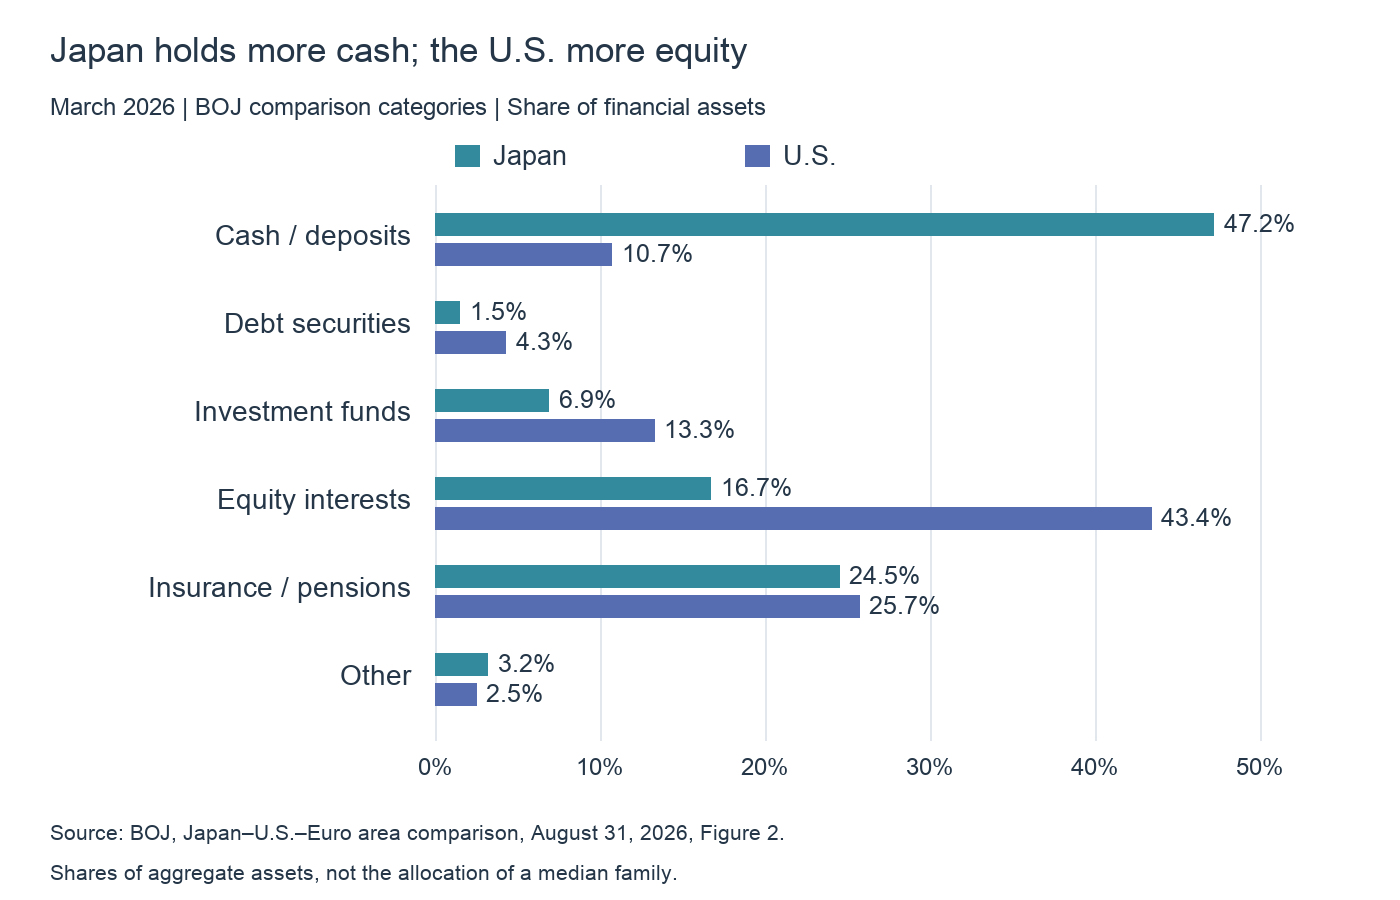
A common classification: 47.2% cash in Japan, 10.7% in the U.S.
The Bank of Japan’s harmonized comparison for March 2026 places cash and deposits at 47.2% of Japanese household financial assets and 10.7% in the U.S. Equity interests account for 16.7% and 43.4%, respectively. Investment funds are 6.9% in Japan and 13.3% in the U.S.; insurance, pensions and guarantees are closer at 24.5% and 25.7%. BOJ comparison, Figure 2
| Asset class | Japan | U.S. |
|---|---|---|
| Cash and deposits | 47.2% | 10.7% |
| Debt securities | 1.5% | 4.3% |
| Investment funds | 6.9% | 13.3% |
| Equity interests | 16.7% | 43.4% |
| Insurance, pensions and guarantees | 24.5% | 25.7% |
| Other | 3.2% | 2.5% |
Funds can own either stocks or bonds, and insurers and pension institutions invest too. Adding every fund to equities would overstate equity exposure; treating pension claims as cash would misdescribe them. Equity interests also include unlisted holdings. The 43.4% figure is not an S&P 500 allocation.
Japan: a long cash-heavy period, then a shift in the 2020s
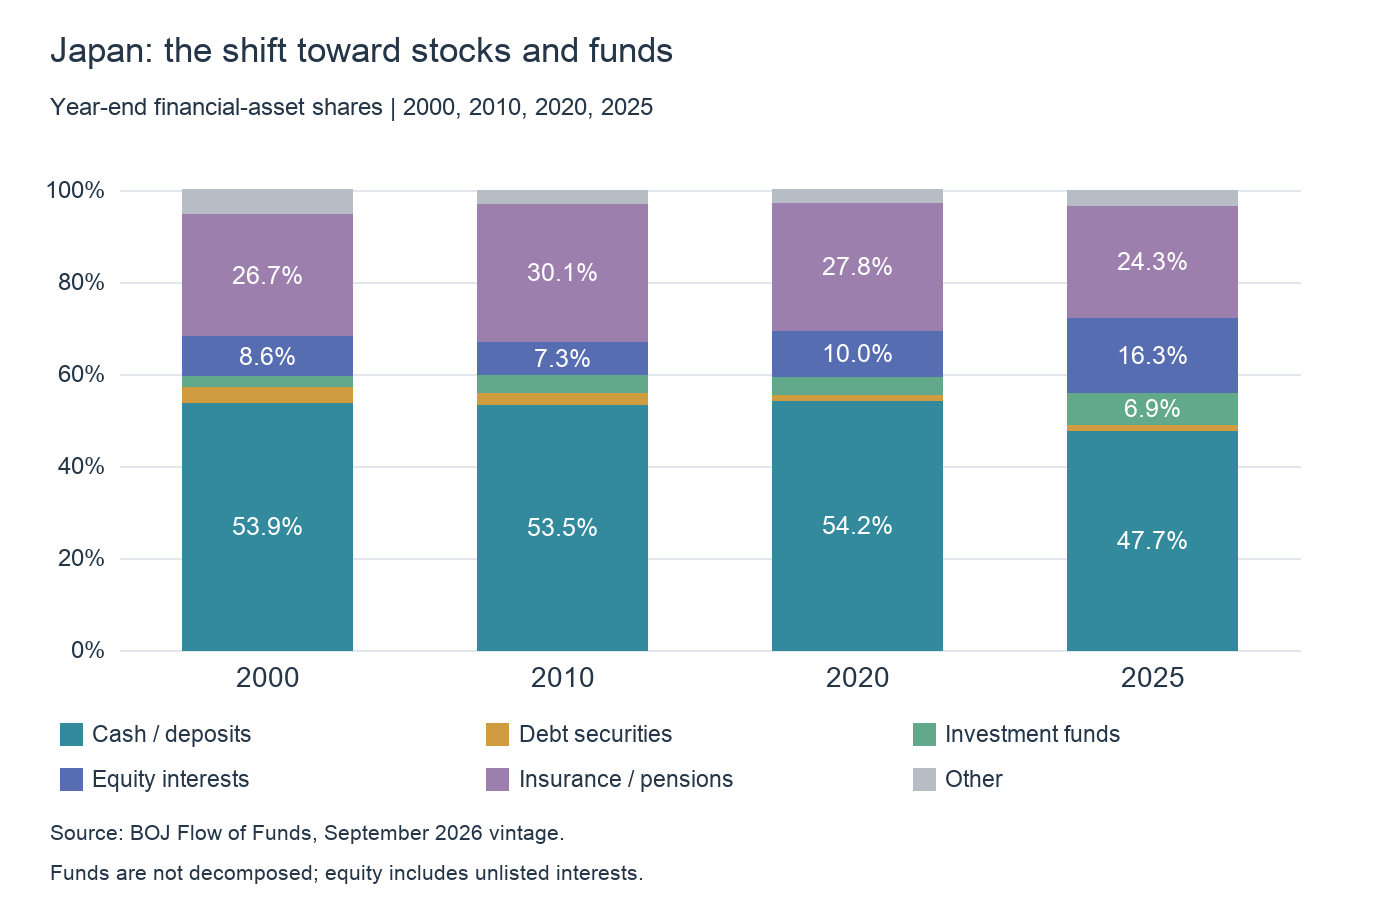
Cash and deposits represented 53.9% of Japanese financial assets at the end of 2000, 53.5% in 2010 and 54.2% in 2020. The share remained slightly above half for two decades, then fell to 47.7% in 2025. Equity interests rose from 8.6% in 2000 to 16.3% in 2025, while investment funds increased from 2.4% to 6.9%. Together, equities and funds rose from 13.9% in 2020 to 23.2% in 2025. Calculated from BOJ quarterly asset stocks
Allocation changes reflect more than purchases. Existing securities can appreciate, and foreign assets can change in yen value. NISA participation helps explain the expansion of investing, but the stock chart cannot attribute every percentage-point shift to new NISA contributions. Transactions and valuation changes are different observations.
A cash-heavy allocation also changes meaning with the price environment. Under deflation, an unchanged cash balance buys more. Under inflation, stable nominal balances and stable purchasing power diverge. The same allocation can therefore face a different problem in the 2020s than it did in the 2000s.
U.S.: include stocks held through funds and retirement arrangements
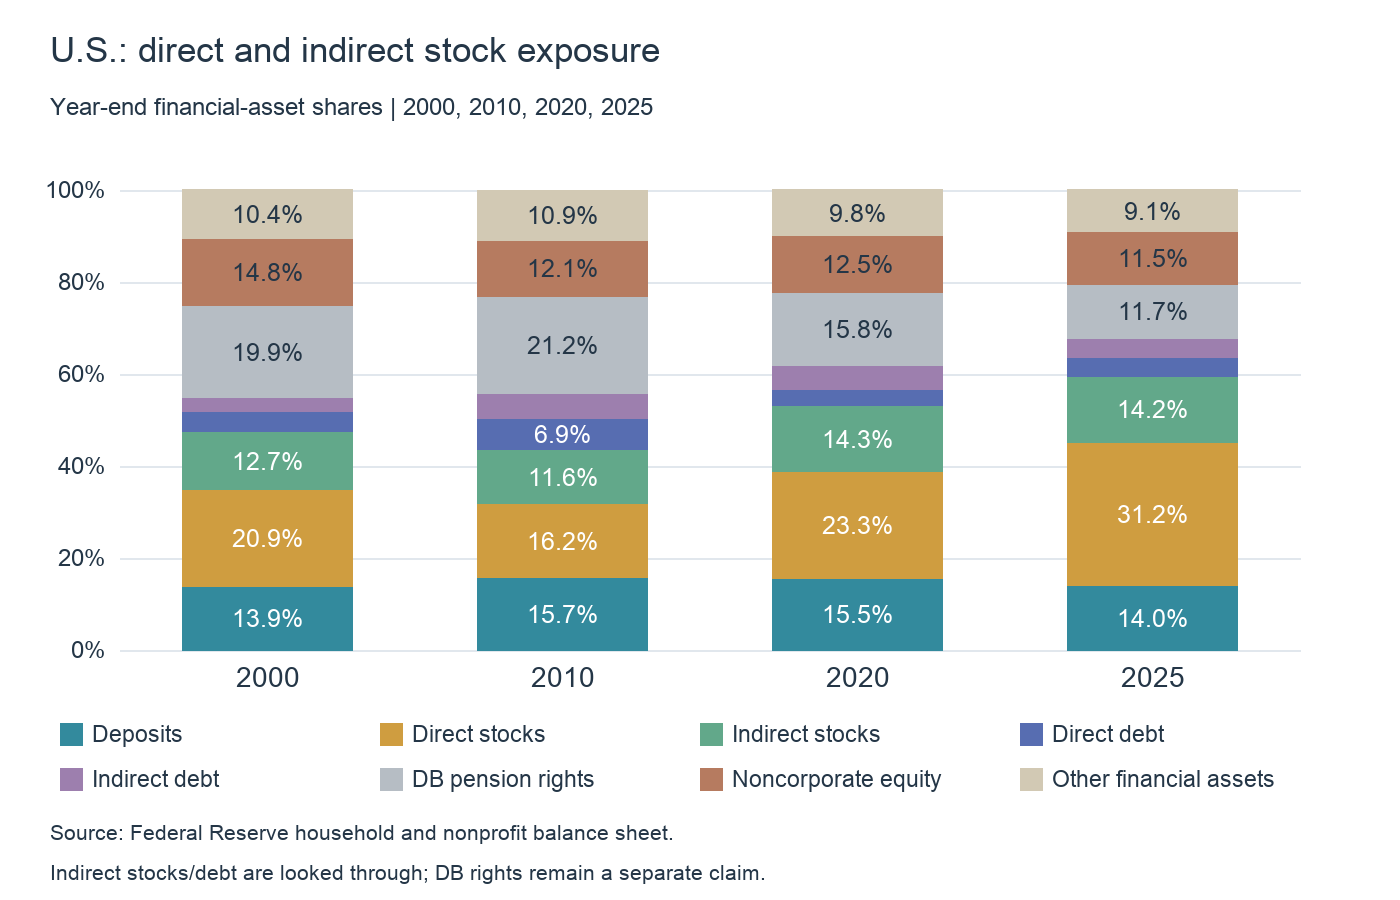
For the U.S. time series, we use the Federal Reserve’s breakdown of direct and indirect equity and debt holdings. Direct stocks accounted for 20.9% in 2000 and indirect stocks 12.7%, a combined 33.6%. By 2025 the corresponding figures were 31.2% and 14.2%, totaling 45.4%. The combined share was only 27.8% in 2010, so the path was not a continuous increase. Federal Reserve balance-sheet table
Defined-benefit pension entitlements remain a separate claim in this presentation. It does not reassign all equities owned by pension institutions directly to households. The Fed sector also includes nonprofit organizations. Its look-through table and the BOJ harmonized comparison operate at different levels: do not splice their 45.4% and 43.4% figures into one series.
Indirect ownership matters in everyday planning. Looking only at a brokerage account can miss equity exposure inside retirement funds. In Japan, the same practical exercise includes corporate defined-contribution plans and iDeCo. Count the underlying assets, not just the number of accounts.
Nominal financial assets: 1.70 times in Japan, 4.14 times in the U.S.
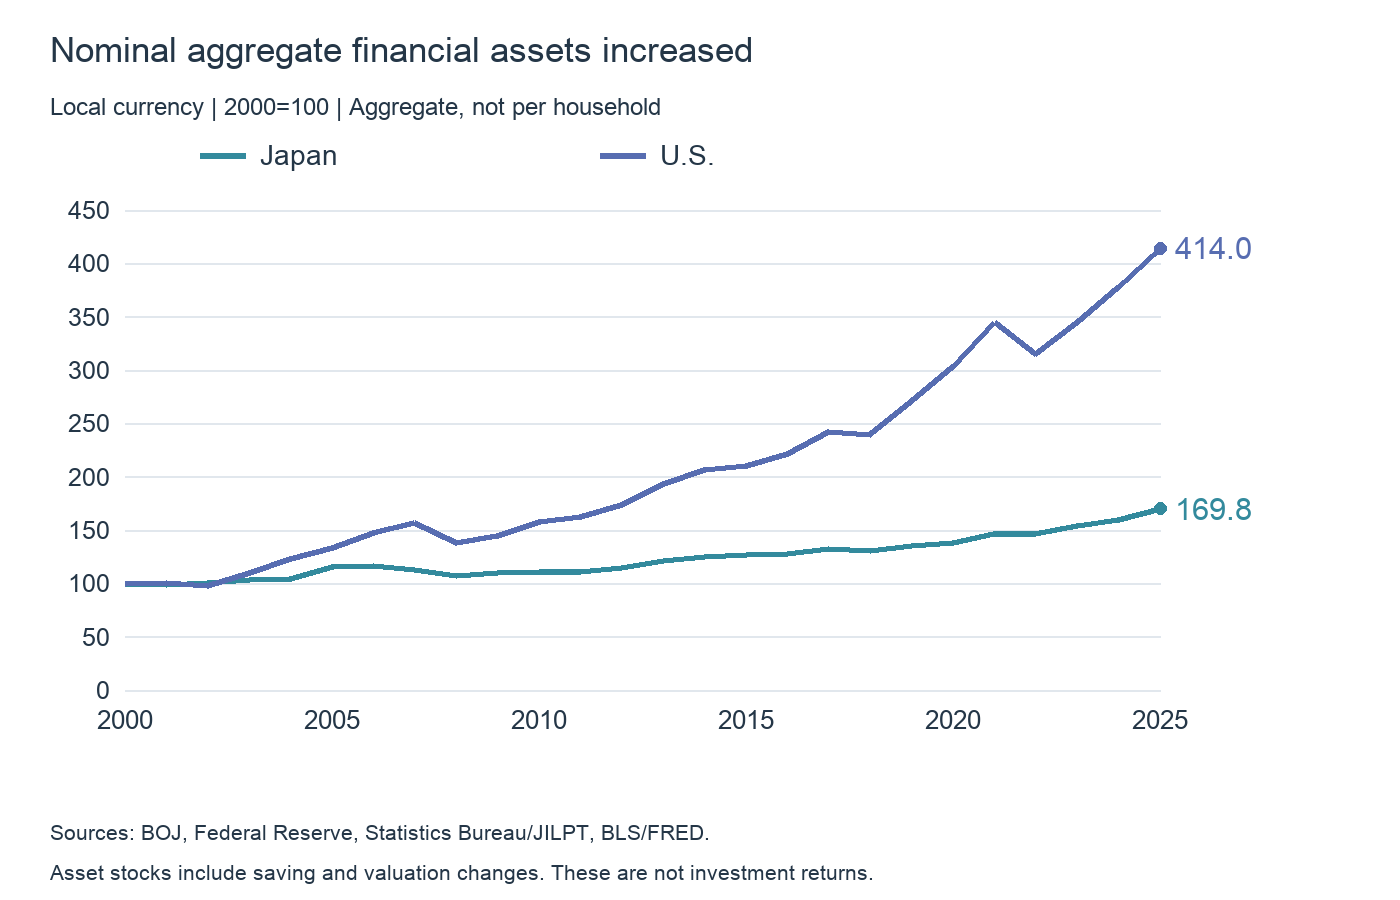
With year-end 2000 set to 100, Japan reaches 169.8 in 2025 and the U.S. 414.0. Japanese assets increased from roughly JPY 1,409 trillion to JPY 2,392 trillion. U.S. assets rose from about USD 34.3 trillion to USD 142.1 trillion. Each series remains in its domestic currency rather than being converted through an exchange rate.
These are changes in asset stocks, not investment returns. They include saving, withdrawals, valuation changes and statistical adjustments. They are not adjusted for population or household counts. The U.S. figure does not mean that a fixed initial portfolio earned 314%, or that every family became four times as wealthy.
After inflation: 1.48 times in Japan, 2.21 times in the U.S.
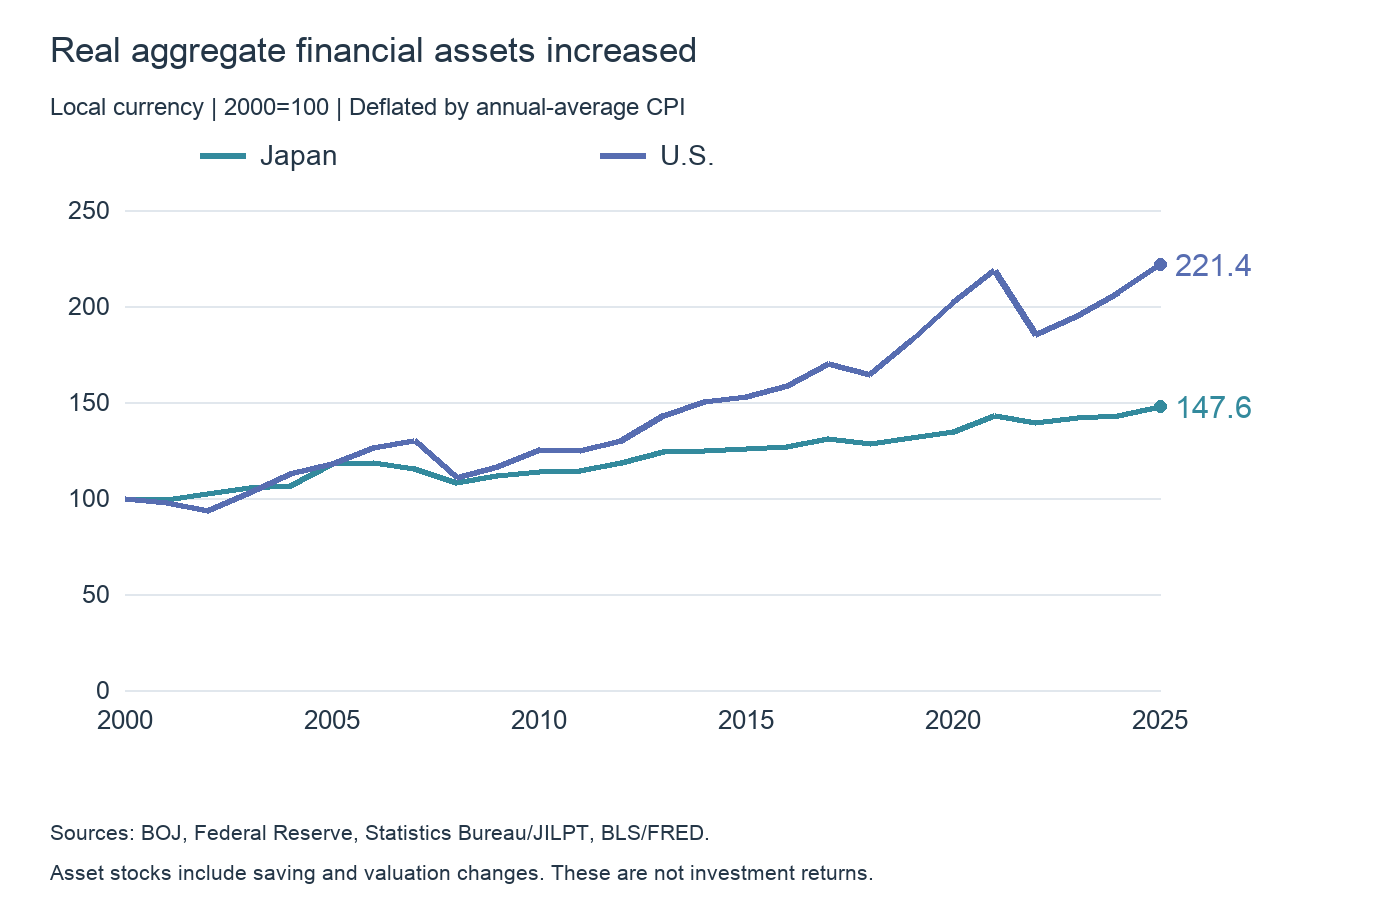
Dividing by each country’s consumer price index and rebasing to 2000 gives 147.6 for Japan and 221.4 for the U.S. in 2025. Aggregate financial assets increased in real terms in both countries. The increase is smaller than the nominal figures suggest.
Japan
| Year-end | Financial assets (JPY trillion) | Nominal index | Real index |
|---|---|---|---|
| 2000 | 1,408.9 | 100.0 | 100.0 |
| 2010 | 1,563.9 | 111.0 | 113.9 |
| 2020 | 1,949.1 | 138.3 | 134.6 |
| 2025 | 2,391.7 | 169.8 | 147.6 |
U.S.
| Year-end | Financial assets (USD trillion) | Nominal index | Real index |
|---|---|---|---|
| 2000 | 34.3 | 100.0 | 100.0 |
| 2010 | 54.4 | 158.4 | 125.1 |
| 2020 | 104.1 | 303.4 | 201.9 |
| 2025 | 142.1 | 414.0 | 221.4 |
The calculation is year-end financial assets divided by that calendar year’s average all-items CPI, relative to the same quantity in 2000. Japan uses Statistics Bureau CPI; the U.S. uses BLS CPI-U, not seasonally adjusted. This values year-end assets at average prices during the year. The 2025 U.S. annual value is BLS’s published 321.943; no missing month is interpolated. Japanese CPI history / BLS annual averages
The start date changes the comparison substantially. Between 2020 and 2025, real aggregate financial assets increased 9.7% in Japan and 9.7% in the U.S. The larger U.S. increase over 25 years does not recur in every five-year window. In 2022, real assets fell 2.3% in Japan and 15.3% in the U.S. relative to 2021. Greater stock exposure brings drawdowns as well as participation in rising markets.
Consider a fixed cash balance with zero interest. Taking its 2020 purchasing power as 100, it buys 89.4 in Japan and 80.4 in the U.S. at 2025 average prices. Actual deposits can earn interest, but checking only that the nominal balance is intact misses inflation’s effect.
National allocations are not ready-made recommendations
Japan’s structure is better insulated against short-run nominal fluctuations but faces purchasing-power erosion when inflation persists. The U.S. structure participates more directly in corporate growth and equity-market declines. The distinction is the risks households bear, not a simple ranking of financial sophistication.
Start a personal allocation with spending reserves, planned purchases and debt repayments. Then decide how much long-term money can bear market fluctuations. A large cash allocation can be reasonable before a house purchase. For money not needed for decades, the consequences of holding everything in cash deserve equal attention.
Use this board to identify the markets affecting household wealth
Place TOPIX beside VTI, BND and USD/JPY. They illustrate Japanese equities, U.S. equities, investment-grade U.S. bonds and the currency translation facing yen-based investors. Watching assets commonly used by households helps identify which kinds of household portfolios are most exposed to today’s market moves. It does not reveal a particular family’s holdings.
For a yen-based household holding unhedged U.S. assets, a U.S. stock gain can be offset by yen appreciation or amplified by yen depreciation. The exact yen return multiplies the asset’s dollar growth factor by the USD/JPY growth factor. Simply adding the two percentage changes is an approximation.
BND is a way to observe the U.S. investment-grade bond market, not a reproduction of Japanese deposits or insurance and pension claims. Japanese and U.S. sessions also differ, so intraday percentage changes should not be added into a household daily profit figure. Use the board for market conditions and actual account statements or fund valuations for household balances.
The lesson is not to copy a U.S. national allocation. Understand where your own finances are exposed to stock prices, interest rates, exchange rates and consumer prices. Returning to what the money can buy keeps financial planning connected to its purpose.
Calculation scope
The international snapshot is the BOJ August 31, 2026 publication for March 2026. Historical calculations use calendar year-end 2000–2025 observations, the September 2026 BOJ revision and the Fed table retrieved October 20, 2026. The snapshot is not spliced into the revised history. Japan covers households; U.S. history covers households and nonprofits. Housing is excluded, liabilities are not subtracted, and household-count and population changes are not removed.
Data and references
- Bank of Japan — Japan–U.S.–Euro area comparison, August 31, 2026, Figure 2
- Bank of Japan — Flow of Funds quarterly household asset stocks, September 2026 revision
- Federal Reserve — Balance Sheet of Households and Nonprofit Organizations
- Statistics Bureau CPI, annual history reproduced by JILPT (2020=100)
- Statistics Bureau of Japan — 2025 CPI annual results
- BLS/FRED — CPI-U all items, not seasonally adjusted
- BLS — Published annual CPI averages, including 2025
- Gallup — What Percentage of Americans Own Stock?
- IMAJ — FY2025 Investment Web Survey