Last year’s best-performing stock can look like this year’s obvious purchase. Rapidly rising shares also attract attention on investment forums. Regret about missing an advance can quickly become a reason to buy after it has happened.
One mechanism is extrapolative expectations: extending recent experience into the future. Greenwood and Shleifer (2014) find that investor return expectations across several surveys are positively associated with past market returns. A strong past market can make investors more optimistic about the next one.
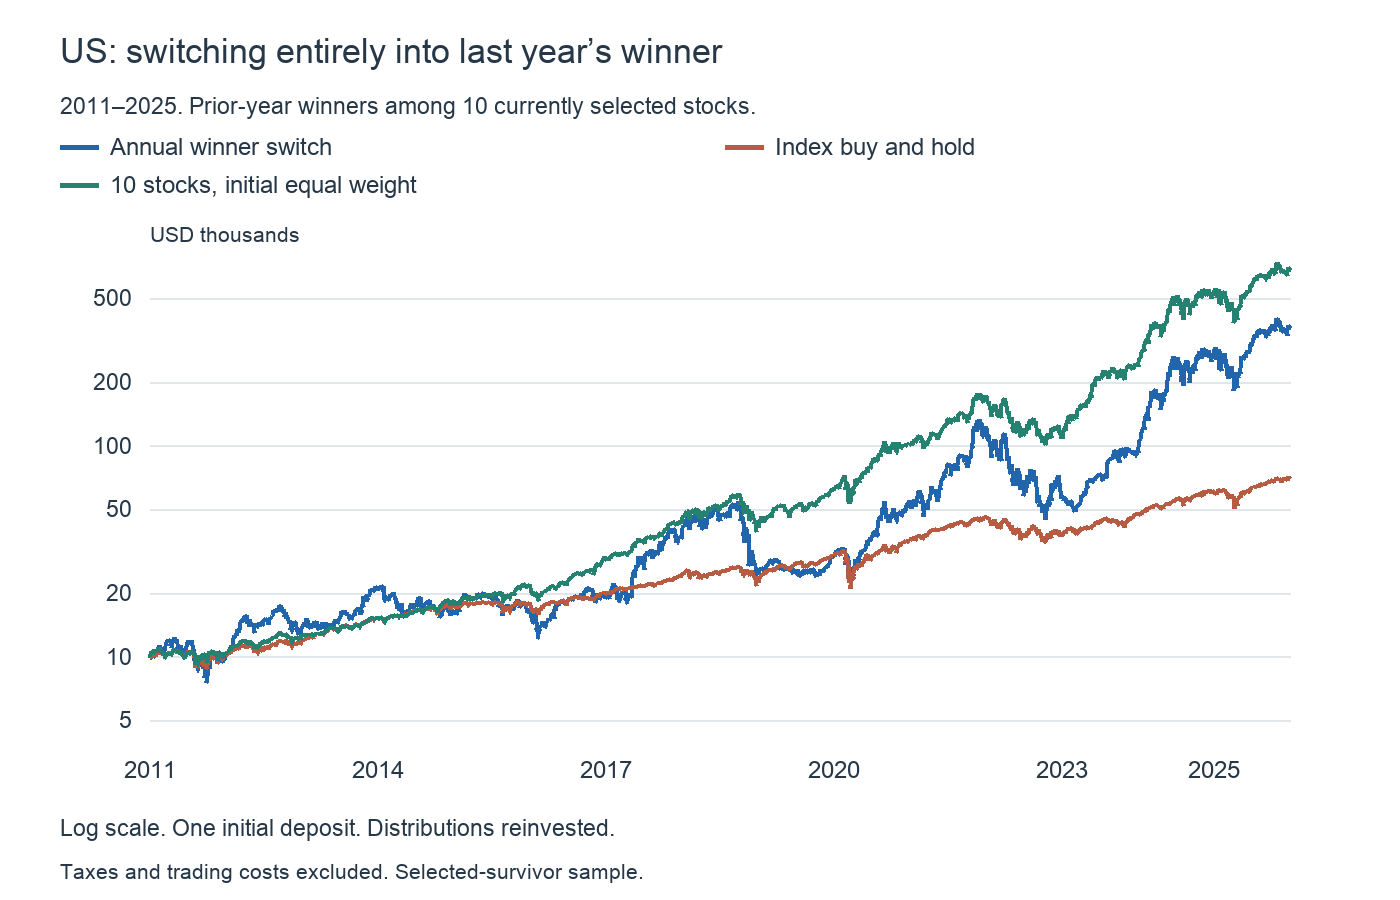
We turn that intuition into two trading rules using ten currently selected US stocks and ten Japanese stocks. Over 2011–2025, both winner strategies beat their index benchmarks in this sample. But switching the entire portfolio experienced drawdowns exceeding 60% in both markets. In the US, simply buying the same ten stocks at equal initial weights and holding them did better than chasing the annual winner.
Attention and profitability require separate evidence
Barber and Odean (2008) find that individual investors tend to be net buyers of attention-grabbing stocks, including those in the news, with unusual volume or with extreme one-day returns. Extreme negative returns also attract buying. Their study does not directly examine today’s message boards, but it helps explain how visibility influences the set of stocks people consider.
Buying past winners is not automatically irrational. Jegadeesh and Titman (1993) document momentum profits over three- to twelve-month horizons from buying past winners and selling past losers. Those are diversified rank-based portfolios across many shares, not a long-only bet on the single best stock of the last calendar year.
Two rules, matched cash flows
1. Switch the entire portfolio. Invest $10,000 in the US or ¥1 million in Japan at the start of 2011. Each January, move everything into the stock with the highest previous calendar-year total return among the candidates. Add no further cash. The index comparison invests the same amount on the same initial date and holds.
2. Direct only new deposits to the winner. Add $10,000 or ¥1 million at the start of every year from 2011 through 2025. Each new deposit buys the prior-year winner. Existing purchases are never sold. Total contributions are $150,000 and ¥15 million respectively. Index portfolios receive identical deposits on identical dates.
Rankings use information through the previous year’s final trading close. Trades occur at the first trading close of the new year, after the signal is known. US portfolios are in dollars and Japanese portfolios in yen. We use distribution- and split-adjusted stock prices, SPY adjusted market prices for the S&P500, and fund 1306’s official distribution-reinvested NAV for TOPIX. NAV is not an executable exchange price.
The US candidates are Walmart, Costco, Berkshire B, Eli Lilly, JPMorgan, NVIDIA, Apple, Microsoft, Amazon, Caterpillar. The Japanese candidates are Toyota Motor, Mitsubishi Heavy Industries, Nintendo, Keyence, Shin-Etsu Chemical, Hitachi, Mitsubishi UFJ FG, Tokio Marine Holdings, Mitsubishi Corporation, INPEX. “Winner” means the best of these currently selected ten, not the best listed stock in either country. These surviving companies include major long-run successes. Survivorship and universe-selection bias remain even though trades correctly follow the annual signal.
US stocks: 36 times the original investment, with a 66% drawdown
| Strategy | Final value (USD) | Annualized return | Annualized risk | Max drawdown |
|---|---|---|---|---|
| Annual winner switch | 363,547 | 27.08% | 40.28% | -66.34% |
| Index buy and hold | 70,162 | 13.88% | 17.17% | -33.72% |
| 10-stock initial equal weight, hold | 684,921 | 32.57% | 26.33% | -42.99% |
The $10,000 winner-switching portfolio ended at approximately $363,547, against $70,162 for SPY. Annualized returns were 27.08% and 13.88%. The strategy substantially outperformed in this particular sample.
Annualized volatility was 40.28%, more than twice SPY’s 17.17%. The maximum drawdown was −66.34%. At that scale, a previous peak of $30,000 would fall to about $10,100. A final balance alone conceals this experience.
Individual holding intervals show both persistence and reversal. NVIDIA bought in January 2021 gained about 130% before the next switch. The January 2022 purchase then lost about 52%. Amazon bought in January 2014 lost about 23%. Prior-year leadership did not prevent a subsequent loss.
| Buy year | Prior-year winner | Prior-year return | Holding-period return | Index return |
|---|---|---|---|---|
| 2011 | Caterpillar | +68.5% | +1.7% | +2.5% |
| 2012 | Apple | +25.6% | +34.7% | +17.1% |
| 2013 | Amazon | +44.9% | +54.7% | +27.8% |
| 2014 | Amazon | +59.0% | -22.5% | +14.5% |
| 2015 | Apple | +40.6% | -2.0% | -0.1% |
| 2016 | Amazon | +117.8% | +18.3% | +14.5% |
| 2017 | NVIDIA | +227.0% | +96.2% | +21.6% |
| 2018 | NVIDIA | +82.0% | -31.5% | -5.1% |
| 2019 | Eli Lilly | +40.5% | +17.7% | +32.3% |
| 2020 | Apple | +89.0% | +73.8% | +15.6% |
| 2021 | NVIDIA | +122.3% | +129.9% | +31.3% |
| 2022 | NVIDIA | +125.5% | -52.4% | -19.0% |
| 2023 | Eli Lilly | +34.3% | +63.9% | +26.0% |
| 2024 | NVIDIA | +239.0% | +187.2% | +25.3% |
| 2025 | NVIDIA | +171.2% | +34.9% | +18.0% |
Holding-period returns run from the first trading close of the purchase year to the first trading close of the next year. The final interval ends at December 2025. These are not exactly calendar-year returns. The strategy beat the index in nine of fifteen intervals and lost money in four. Its large final gain did not require winning every interval.
Japanese stocks: ahead of TOPIX, with almost twice the drawdown
| Strategy | Final value (JPY 10,000s) | Annualized return | Annualized risk | Max drawdown |
|---|---|---|---|---|
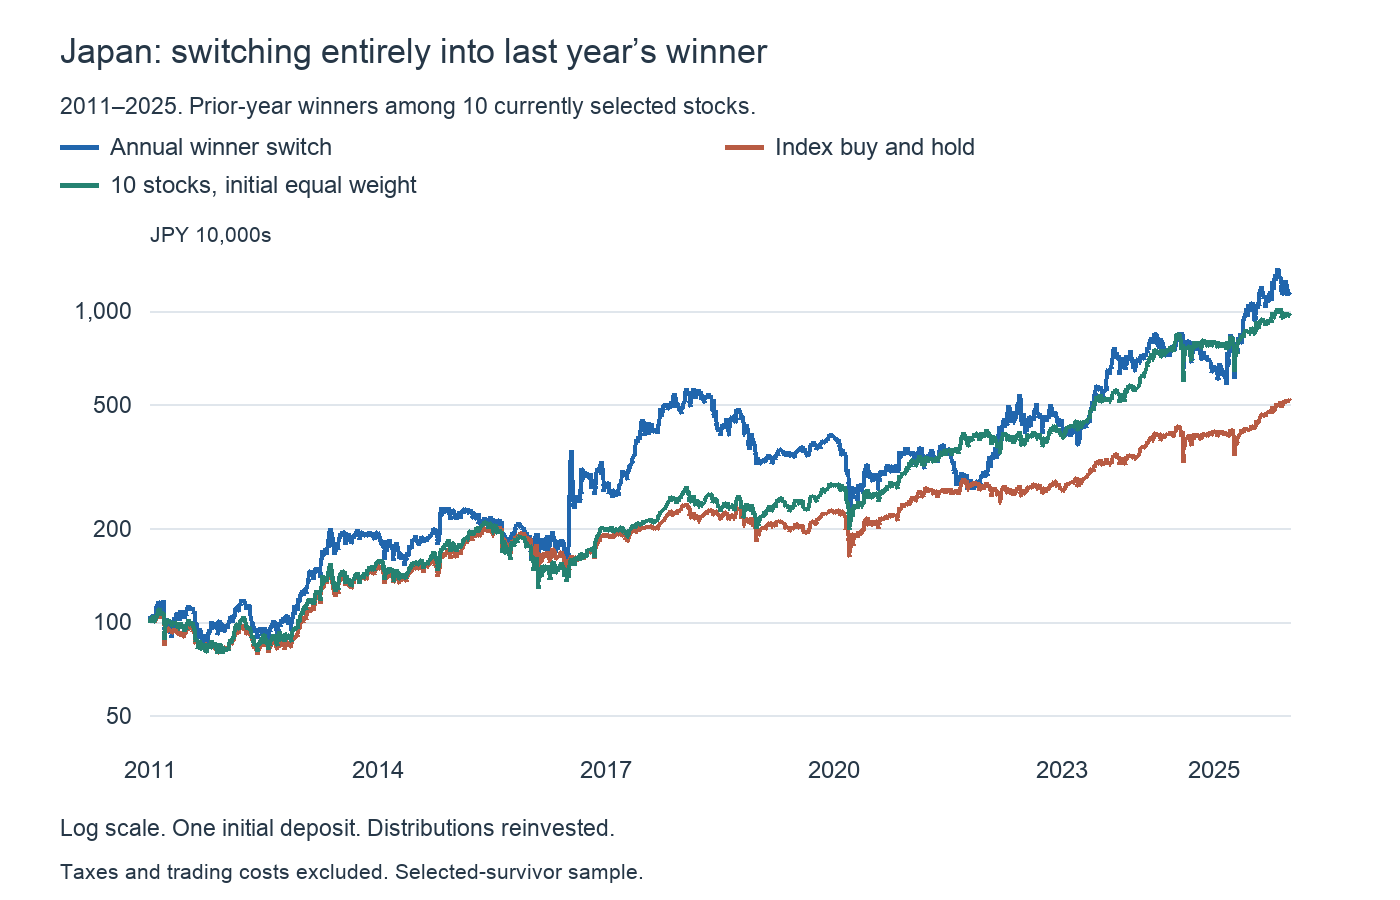
| Annual winner switch | 1,130 | 17.56% | 37.69% | -61.85% |
| Index buy and hold | 517 | 11.58% | 19.43% | -32.33% |
| 10-stock initial equal weight, hold | 969 | 16.36% | 23.20% | -39.34% |
The initial ¥1 million became approximately ¥11.30 million under winner switching and ¥5.17 million in the TOPIX proxy. Annualized returns were 17.56% and 11.58%. Maximum drawdowns were −61.85% and −32.33%.
Nintendo purchases in 2016 and 2017 produced successive strong gains, while the 2018 purchase lost about 34%. Its 2021 purchase also lost about 14%. INPEX in 2022 and Mitsubishi Heavy Industries in 2023 and 2025 provide examples where prior strength persisted into the following holding interval.
| Buy year | Prior-year winner | Prior-year return | Holding-period return | Index return |
|---|---|---|---|---|
| 2011 | Hitachi | +54.5% | -3.1% | -16.6% |
| 2012 | Mitsubishi Heavy Industries | +9.1% | +30.8% | +22.3% |
| 2013 | Toyota Motor | +58.9% | +51.2% | +48.0% |
| 2014 | Keyence | +89.0% | +15.7% | +10.5% |
| 2015 | Shin-Etsu Chemical | +30.2% | -16.6% | +9.7% |
| 2016 | Nintendo | +34.5% | +48.0% | +5.2% |
| 2017 | Nintendo | +47.5% | +79.9% | +22.3% |
| 2018 | Nintendo | +71.1% | -34.2% | -19.4% |
| 2019 | Tokio Marine Holdings | +6.6% | +19.8% | +18.2% |
| 2020 | Hitachi | +61.6% | -10.3% | +8.2% |
| 2021 | Nintendo | +54.9% | -14.2% | +15.4% |
| 2022 | INPEX | +89.7% | +39.1% | -5.6% |
| 2023 | Mitsubishi Heavy Industries | +102.1% | +70.1% | +30.5% |
| 2024 | Shin-Etsu Chemical | +86.8% | -7.4% | +18.5% |
| 2025 | Mitsubishi Heavy Industries | +173.6% | +72.5% | +26.7% |
The Japanese strategy beat its index in ten of fifteen intervals and lost money in six. Moving the entire balance into one company made that company’s setbacks portfolio-wide events.
What changes when only new money buys the winner?
Keeping earlier purchases creates a different portfolio. Multiple purchase years and multiple companies can remain invested, rather than replacing the entire account every January.
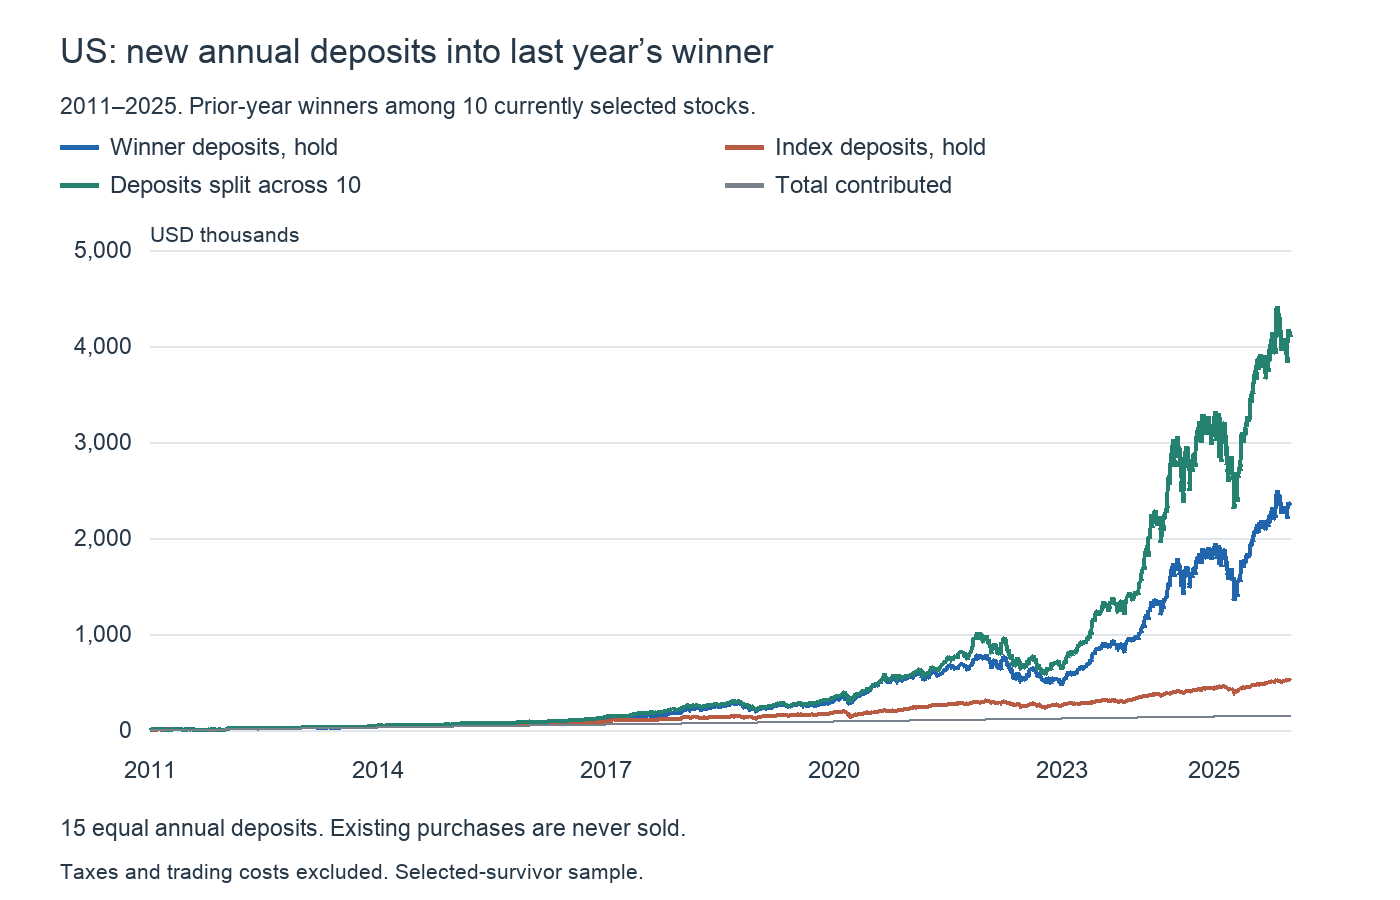
| Strategy | Final value (USD) | Money-weighted return | Annualized risk | Max drawdown |
|---|---|---|---|---|
| Winner deposits, hold | 2,337,054 | 30.80% | 28.01% | -40.94% |
| Index deposits, hold | 519,934 | 14.45% | 17.17% | -33.72% |
| 10-stock equal deposits, hold | 4,102,838 | 36.96% | 26.56% | -43.67% |
With $150,000 contributed, winner deposits held to the end produced approximately $2.337 million, compared with $519,934 for index deposits. NVIDIA bought in earlier years, including 2017, remained invested through later advances. NVIDIA represented approximately 58.9% of the final portfolio. Buying across many years did not keep the resulting holdings evenly diversified.
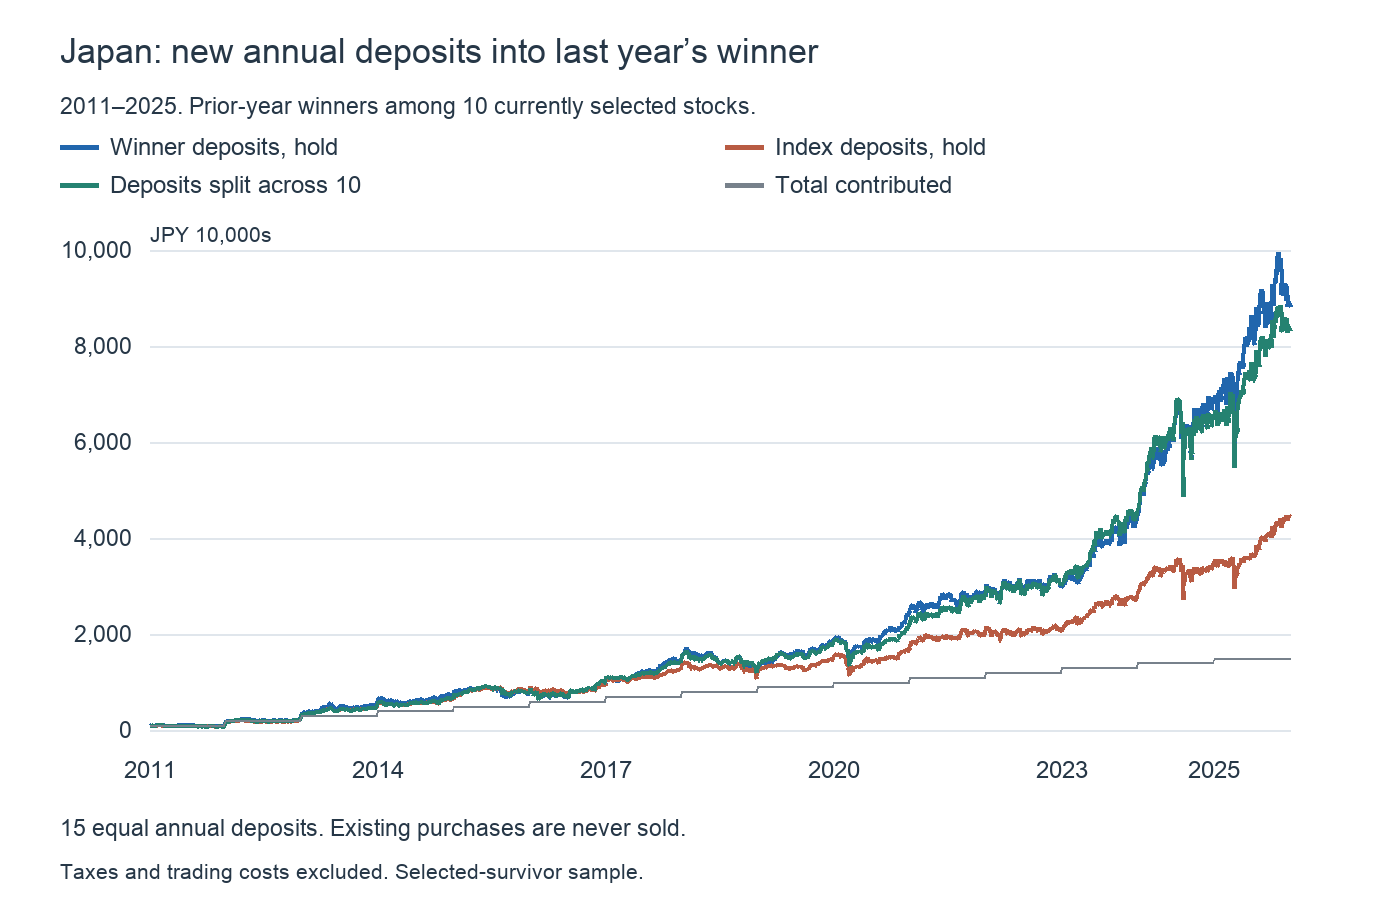
| Strategy | Final value (JPY 10,000s) | Money-weighted return | Annualized risk | Max drawdown |
|---|---|---|---|---|
| Winner deposits, hold | 8,818 | 20.25% | 25.41% | -39.76% |
| Index deposits, hold | 4,443 | 12.71% | 19.43% | -32.33% |
| 10-stock equal deposits, hold | 8,316 | 19.61% | 22.97% | -38.83% |
In Japan, ¥15 million of deposits became approximately ¥88.18 million under winner accumulation and ¥44.43 million under index accumulation. Mitsubishi Heavy Industries accounted for approximately 28.9% of the winner portfolio, Hitachi 23.5% and Nintendo 20.8%. Together these three represented about 73%.
Money-weighted return is XIRR calculated from the actual deposit dates and terminal wealth. It is not an annualization of final wealth divided by total contributions. Volatility and maximum drawdown use returns that remove external deposit effects, so contributing new cash cannot disguise an investment loss.
Did selecting the winner help, or were the candidates unusually strong?
The green lines provide another control. Invest one tenth of the initial deposit in each candidate and hold. In the annual-deposit version, split every new deposit equally across the ten. Neither rule rebalances existing holdings back to equal weights.
In the US, initial equal-weight buy and hold turned $10,000 into approximately $684,921, exceeding winner switching’s $363,547. Equal annual deposits reached approximately $4.103 million, exceeding winner accumulation’s $2.337 million. The strength of these selected companies cannot all be credited to choosing last year’s winner.
In Japan, initial equal-weight buy and hold reached approximately ¥9.69 million, while equal annual deposits reached ¥83.16 million. Both ended below their corresponding winner strategies, but experienced lower volatility and shallower maximum drawdowns. Additional return came with additional variation.
We also removed NVIDIA from the US candidates and repeated the rules with the remaining nine. Winner switching ended at approximately $319,710 and winner accumulation at $1.168 million. NVIDIA was not the sole source of success, but removing it roughly halved the accumulation result. This check still uses other successful companies selected today; it does not remove the original universe bias.
The path matters before the final profit
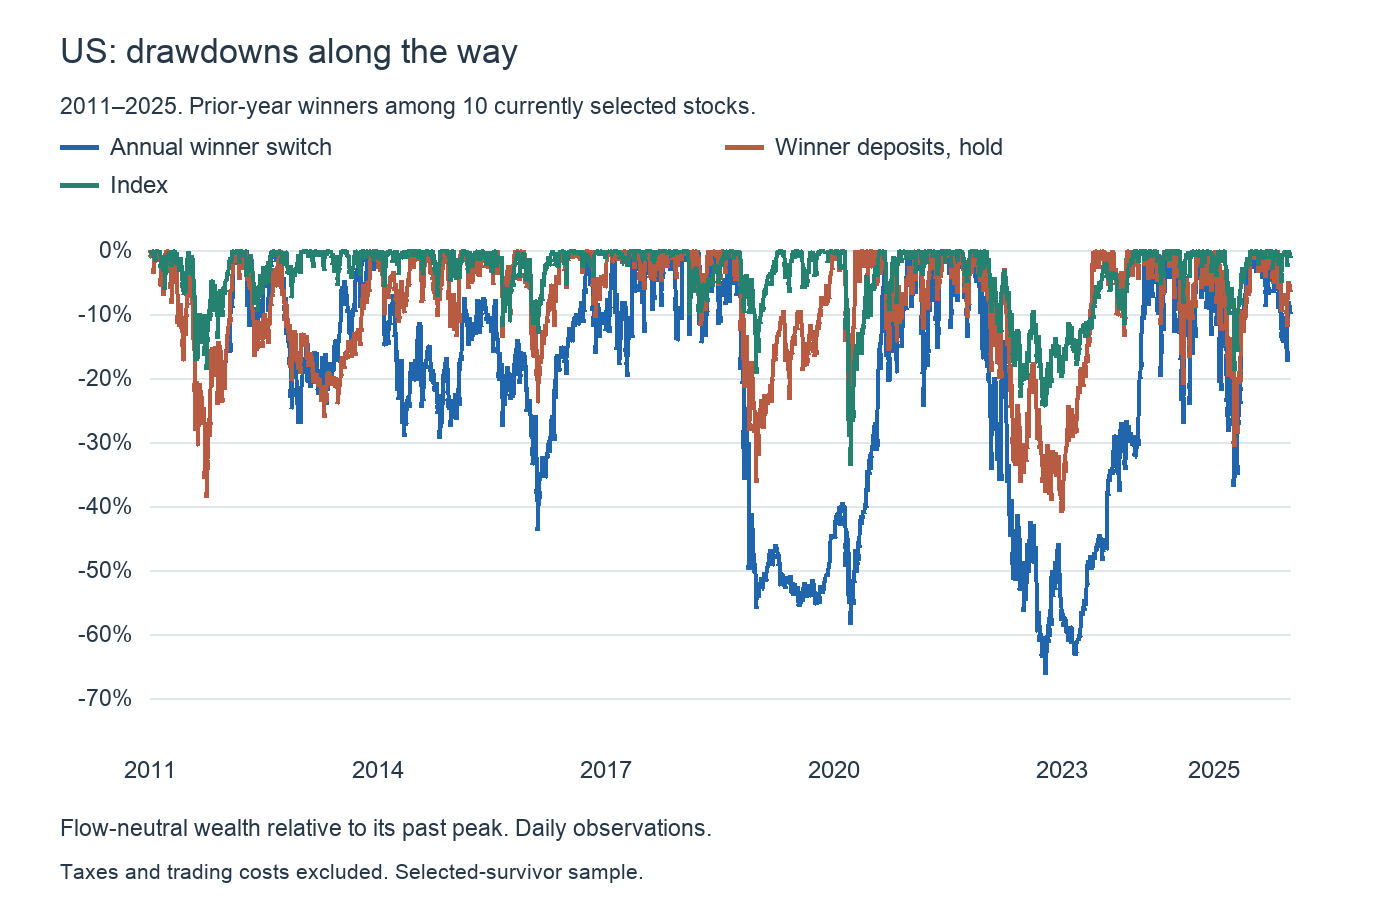
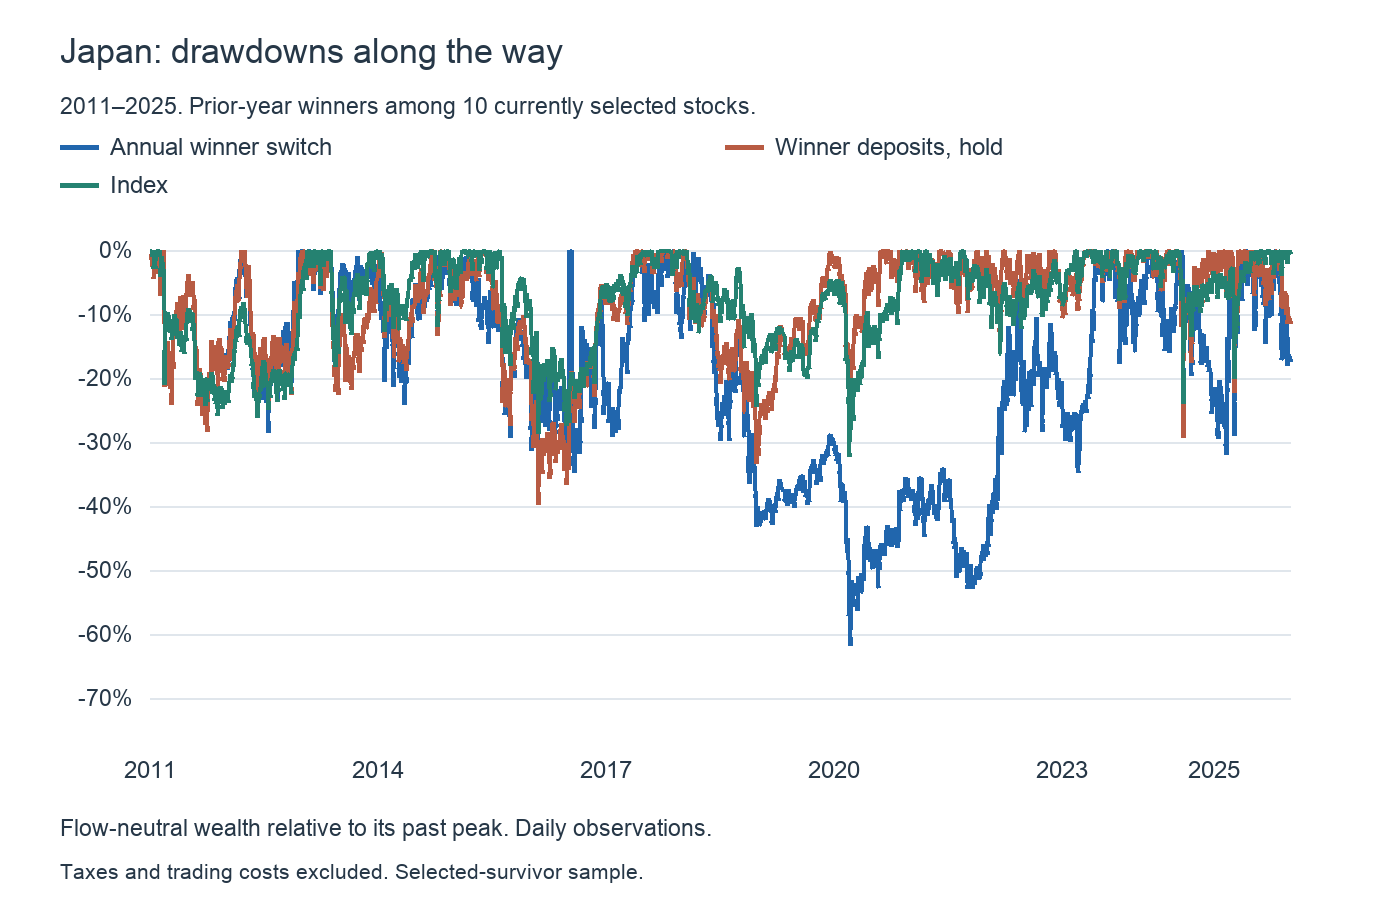
In both markets, retaining past purchases and directing only new deposits to the winner reduced maximum drawdown relative to switching everything. Yet drawdowns still reached approximately 41% in the US and 40% in Japan. Holding several purchase cohorts does not automatically control a growing position or an industry concentration.
For practical allocation, first set a limit on individual stocks within the overall portfolio, then review company and sector concentrations each January. New deposits can adjust weights without selling, but may not be large enough to dilute a position that has grown substantially. Full switching can also realize taxable gains repeatedly, reducing results relative to our tax-free calculation.
On the board, compare the S&P500 or TOPIX with the individual shares you follow. This helps distinguish a broad-market move from a company-specific one. Daily percentage changes are not previous-calendar-year total-return rankings and do not reproduce this strategy.
Following winners made money in this sample. It also required tolerating deeper declines than index investing, and the candidate universe substantially influenced the outcome. A single condition, last year’s first-place return, cannot establish either an investment’s overall quality or an investor’s ability to stay with it.
Calculation details
We exclude zero-volume or missing stock observations and use dates with prices for every asset in each market: 3,772 US observations and 3,666 Japanese observations. Missing prices are not interpolated. Returns across missing trading dates can span multiple sessions. Volatility and drawdown statistics describe this common-observation series.
The first signal uses calendar 2010 returns. Evaluation runs from the January 3, 2011 US close or January 4 Japanese close through the final December 2025 close. Stocks and SPY use cached distribution- and split-adjusted daily closes. The TOPIX proxy uses official distribution-reinvested NAV for NEXT FUNDS TOPIX ETF 1306. Total returns assume distributions are reinvested in the same holding. The ten candidates per market are fixed from currently covered companies, excluding delisted companies and the full historical listed universe. Rank prior-calendar-year returns, trade at the next first trading close and retain the same position when the winner repeats. One-deposit annualized returns use actual elapsed days divided by 365.25; multiple deposits use dated XIRR. Annualized risk is sample standard deviation of daily flow-neutral returns times √252. Maximum drawdown is measured from the running peak of a flow-neutral wealth index. Fractional shares are allowed. Personal taxes, commissions, bid–ask spreads, inflation, dollar–yen conversion and Japanese board-lot constraints are excluded. Fund expenses are reflected in the input series.
Data and references
- Greenwood & Shleifer (2014): Expectations of Returns and Expected Returns
- Barber & Odean (2008): All That Glitters
- Barber & Odean: author manuscript, September 2001
- Jegadeesh & Titman (1993): Returns to Buying Winners and Selling Losers
- State Street: SPY fund and benchmark information
- NEXT FUNDS: TOPIX ETF 1306, official historical NAV
- Yahoo Finance: previously cached adjusted daily stock and SPY prices