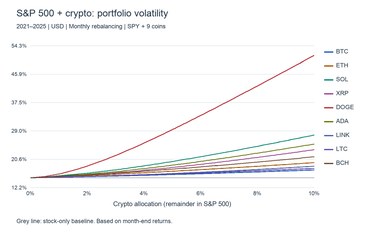
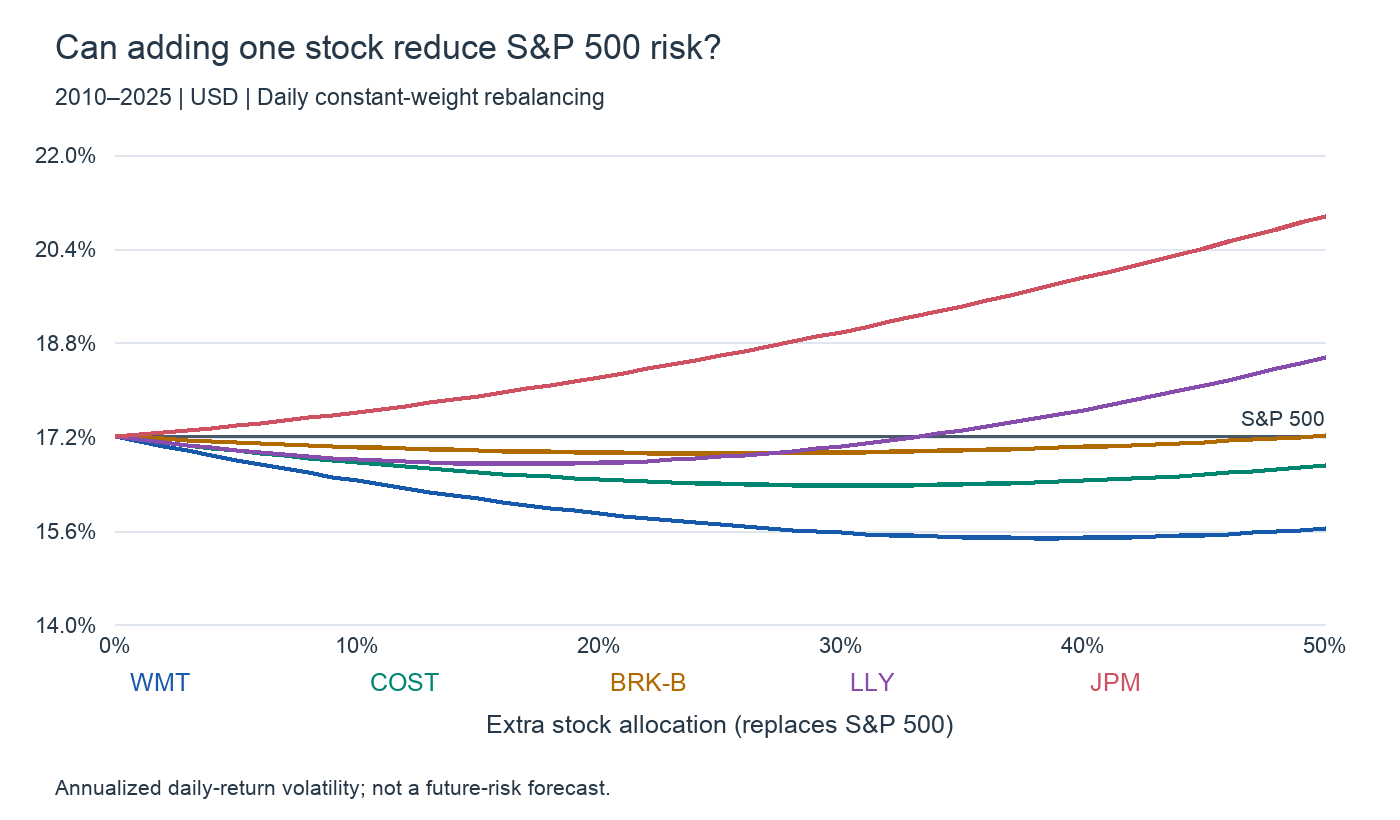
Adding an individual stock to an S&P 500 holding does not invariably increase portfolio risk. In 2010–2025, replacing 10% of the S&P 500 allocation with Walmart reduced annualized volatility from 17.21% to 16.45%. Replacing the same 10% with NVIDIA increased it to 18.71%. Walmart itself was more volatile than the index: 19.60%. What matters is how the added stock moves with the existing portfolio.
Why market-cap weighting became a foundation
Harry Markowitz’s 1952 work evaluated expected return and variance at the portfolio level, including the covariance between assets. Sharpe and other researchers extended portfolio choice into an equilibrium model during the 1960s. Nobel Prize research history
The important distinction is that the CAPM market portfolio is not the global minimum-variance portfolio. In the basic model with a risk-free asset, it is the tangency portfolio, maximizing expected excess return per unit of risk. A different allocation can have lower volatility and lower expected return without contradicting the model.
The theoretical market also encompasses invested wealth, not just U.S. large-cap stocks. The S&P 500 began in 1957 and uses float-adjusted market-cap weighting. It reflects market size rather than solving a historical minimum-variance optimization. S&P DJI / Fama and French’s review of CAPM
Ten stocks on this site, one consistent comparison
We compare Walmart, Costco, Berkshire Hathaway, Eli Lilly, JPMorgan Chase, NVIDIA, Apple, Microsoft, Amazon and Caterpillar. They span different businesses and have pre-2010 price histories. These are companies currently featured on this site, not a strategy selected from the complete 2010 investment universe.
All returns use U.S.-dollar daily prices adjusted for dividends and splits. SPY supplies an investable, distribution-reinvested S&P 500 proxy, including fund expenses. It is not the price-only index displayed on the live board. SPY is used for research only and is not being added to the site’s instrument catalog.
A 10% allocation means 90% in the index proxy and 10% in the stock, not 100% plus a leveraged purchase. Main curves reset weights daily. Risk is sample daily-return standard deviation multiplied by √252.
Some stocks lower risk; others amplify it
| Stock | Stock risk | Correlation | Beta | 90:10 risk | Change (pp) |
|---|---|---|---|---|---|
| WMT | 19.60% | 0.442 | 0.503 | 16.45% | -0.76 |
| COST | 20.29% | 0.586 | 0.690 | 16.76% | -0.45 |
| BRK-B | 19.40% | 0.768 | 0.866 | 17.03% | -0.19 |
| LLY | 26.11% | 0.445 | 0.675 | 16.82% | -0.40 |
| JPM | 27.60% | 0.736 | 1.180 | 17.62% | +0.41 |
| NVDA | 45.70% | 0.630 | 1.673 | 18.71% | +1.50 |
| AAPL | 28.17% | 0.690 | 1.129 | 17.55% | +0.34 |
| MSFT | 25.49% | 0.750 | 1.111 | 17.49% | +0.27 |
| AMZN | 32.82% | 0.610 | 1.162 | 17.68% | +0.47 |
| CAT | 29.24% | 0.681 | 1.156 | 17.61% | +0.40 |
The S&P 500 proxy alone had 17.21% annualized volatility. Walmart, Costco, Berkshire and Lilly lowered it at a 10% weight; the other six increased it. This statistic describes return variability, not a maximum possible loss.
Walmart and Costco illustrate why a business label is insufficient. Their full-sample betas were about 0.50 and 0.69. Their correlations with the index differed as well. Shared market exposure, not merely standalone volatility, determines their initial effect.
The marginal condition is beta below one
With stock weight w, portfolio variance is (1−w)²σ²M + w²σ²S + 2w(1−w)Cov(M,S). Beta is the covariance with the index divided by index variance. At w=0, the derivative is 2σ²M(β−1). A stock with beta below one therefore reduces variance for a sufficiently small allocation.
Correlation below one alone is not enough. A very volatile stock can still have beta above one. NVIDIA’s full-sample beta was 1.67, and adding it increased risk in this comparison.
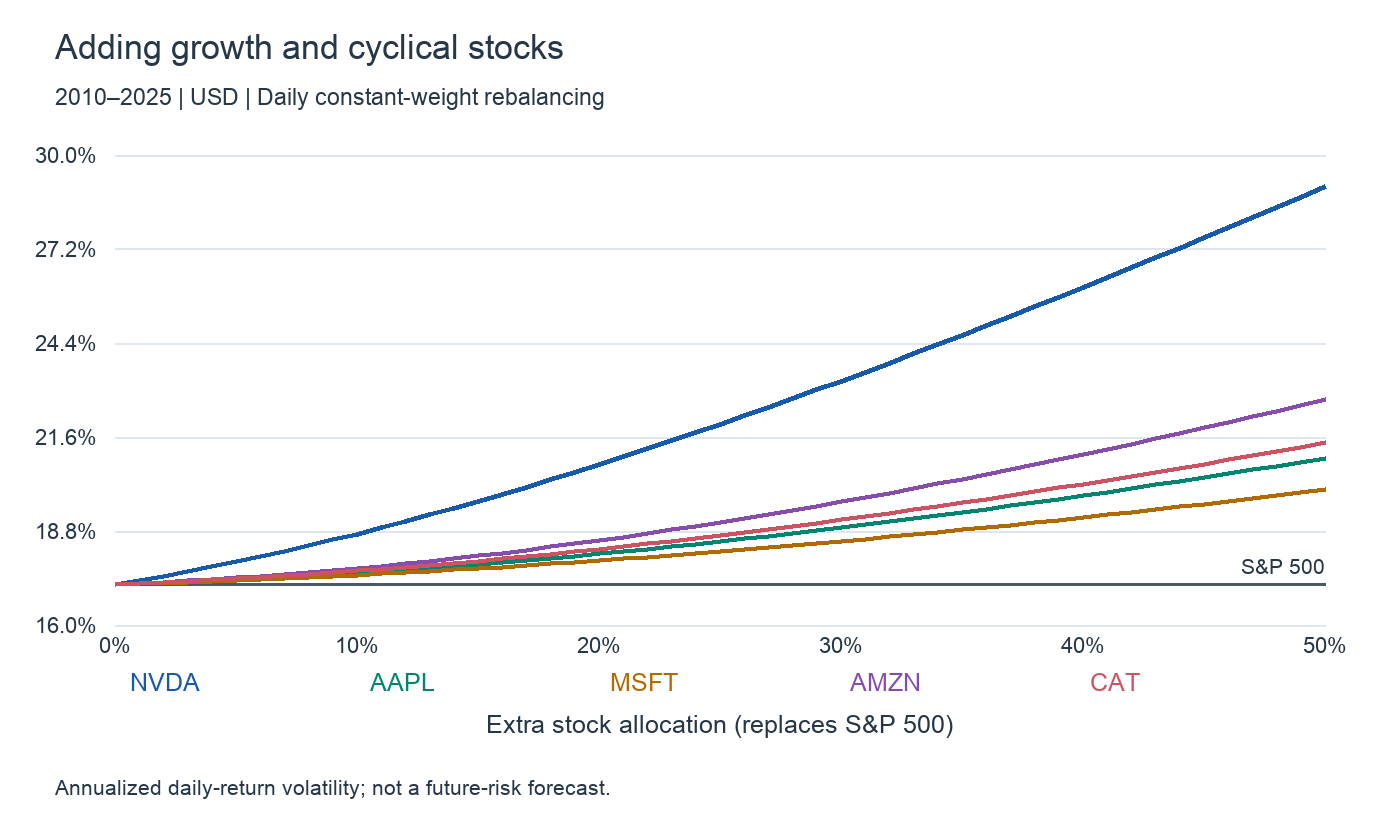
Even a low-beta stock eventually introduces enough company-specific risk to turn the curve upward. The following minima use the analytic two-asset variance solution constrained to 0–50% extra stock exposure; plotted curves use one-percentage-point steps.
| Stock | Extra weight | Minimum risk |
|---|---|---|
| WMT | 38.5% | 15.48% |
| COST | 30.7% | 16.37% |
| BRK-B | 24.9% | 16.92% |
| LLY | 16.7% | 16.74% |
These are retrospective minima, not today’s recommended weights. A stock already held inside the index becomes an overweight: no new company is added to the index’s breadth. Exposure to other constituents is reduced proportionately.
Set weights in the first decade; test them later
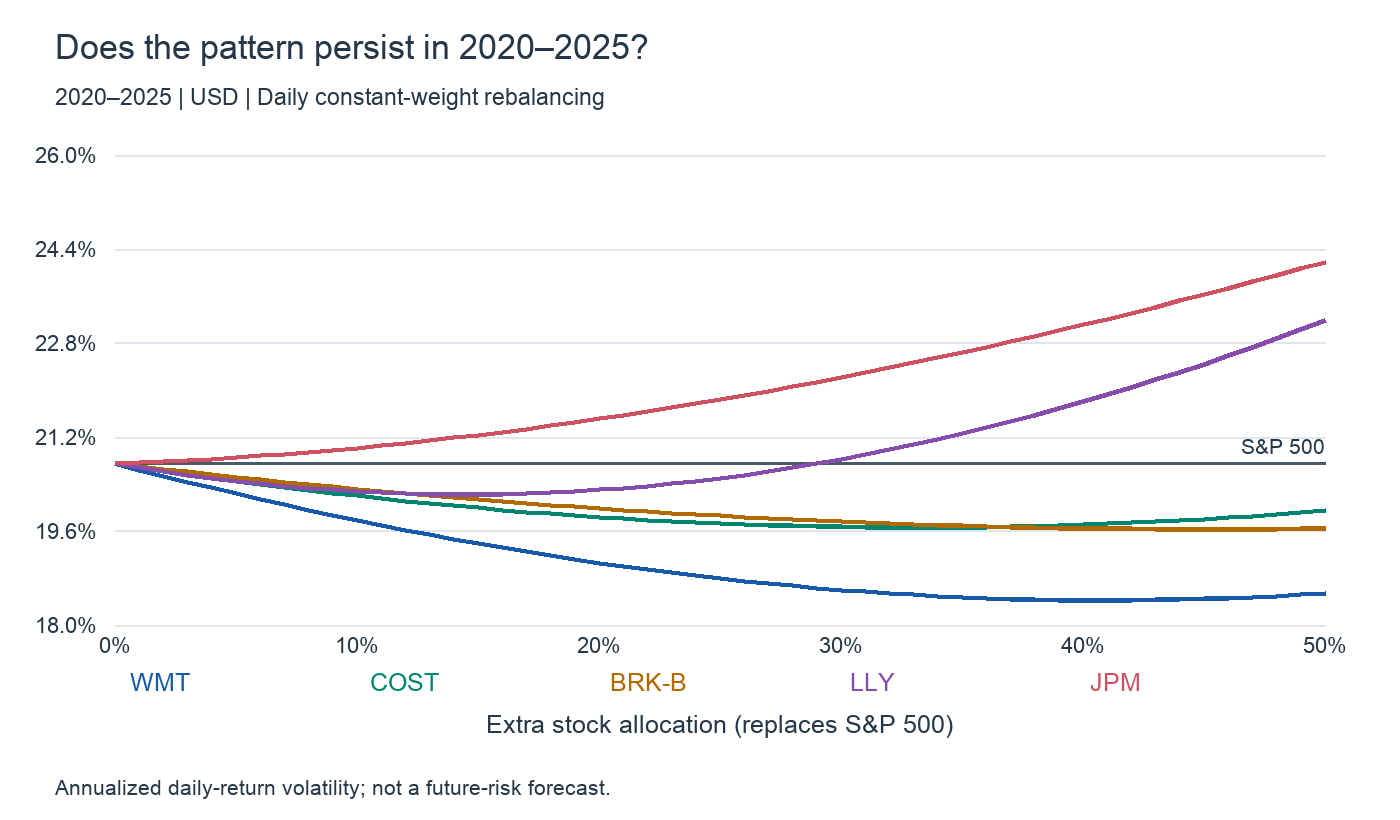
S&P 500 volatility rose to 20.74% in 2020–2025. We estimated minimum-risk weights using only 2010–2019 and retained those weights in the later period, without optimizing again on the test returns.
| Stock | 2010–2019 weight | 2020–2025 risk | S&P 500 risk |
|---|---|---|---|
| WMT | 35.7% | 18.46% | 20.74% |
| COST | 28.2% | 19.68% | 20.74% |
| BRK-B | 3.0% | 20.60% | 20.74% |
| LLY | 20.9% | 20.33% | 20.74% |
All four retained lower volatility in the later sample. Berkshire’s training weight was only 3.0%, so its subsequent reduction was small. Optimizing directly on the later period would instead produce a 45.1% weight. The contrast shows the instability of precise estimated weights. The chronological split does not remove the hindsight involved in choosing today’s surviving companies.
A down year and a more practical reset schedule
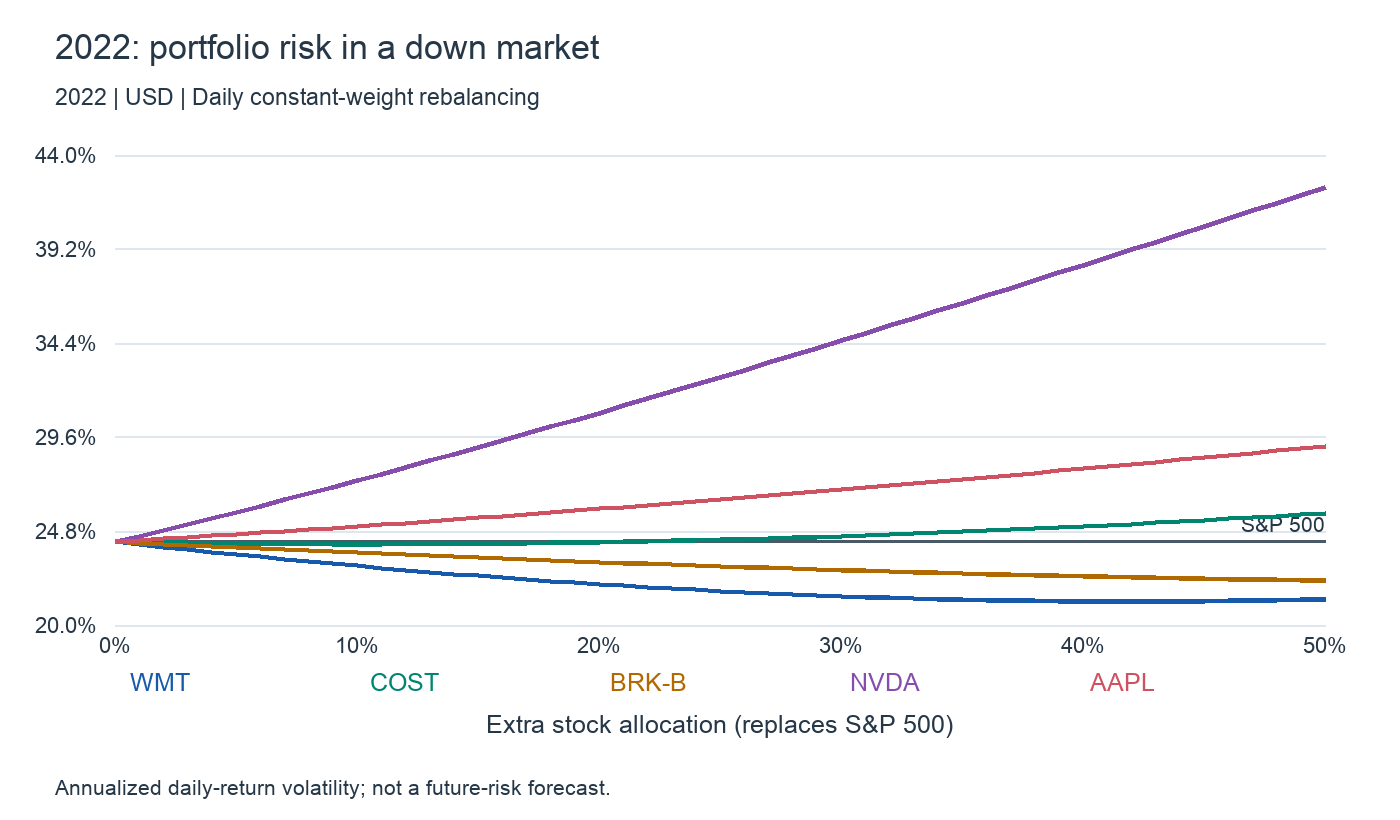
In 2022, index volatility was 24.24%; a 10% Costco tilt produced 24.13%, only a small reduction. Caterpillar increased full-sample risk at 10% but reduced it in 2022. A permanent “defensive” label cannot replace period-specific measurement.
| Stock | Daily reset | Monthly reset |
|---|---|---|
| WMT | 16.45% | 16.43% |
| COST | 16.76% | 16.74% |
| BRK-B | 17.03% | 17.03% |
| NVDA | 18.71% | 18.72% |
The monthly version starts at 90:10, lets weights drift with returns and resets at month-end. For these examples, daily versus monthly resetting did not change whether risk rose or fell. Trading costs, spreads and taxes are excluded.
This is portfolio theory at work, not its defeat
Lower volatility does not by itself refute CAPM or demonstrate a higher future Sharpe ratio. The minimum-risk objective differs from maximizing expected risk-adjusted return. The covariance calculation is a direct application of portfolio theory.
Real-world restrictions still matter. Frazzini and Pedersen’s Betting Against Beta studies how leverage constraints can influence demand for high-beta assets. It offers a pricing mechanism, not proof of what caused Walmart’s behavior in this sample. Original paper
Fama and French discuss empirical problems and imperfect proxies for the market portfolio. Ledoit and Wolf address covariance-estimation error through shrinkage. Our calculation uses ordinary two-asset sample covariances, not shrinkage or a model forecasting future returns. Small changes in estimated inputs can shift a retrospective optimum. Covariance research
Use the board to compare the core with the tilt
Place the S&P 500 beside Walmart, Berkshire and NVIDIA. Compare their reactions on large market moves and company earnings days. One intraday chart cannot establish a long-run beta or correlation: those require aligned observations in the same currency over a meaningful period.
These results are dollar-based; yen-based investors also face currency translation. A lower historical standard deviation does not remove company-specific earnings, litigation or management risk. Keep stock weights deliberate and review them on a defined schedule rather than repeatedly chasing the newest estimated optimum.
The S&P 500 remains a useful broad U.S. equity core. A useful core and the lowest-volatility allocation are different things. When adding a stock, measure its effect on the whole portfolio, not just its past price appreciation.
Calculation details
Common trading days in 2010–2025; USD dividend/split-adjusted daily prices; sample standard deviation, ddof=1, annualized with252 days. Stock weights replace part of the index, with no short selling or leverage. Main curves use daily constant weights; the monthly check allows drift between resets. Minima are constrained analytic two-asset variance minima over0–50%. Volatility is not drawdown or a bound on future loss. Price history / SPY manager documentation
Data and references
- Nobel Prize — Markowitz and Sharpe research history
- S&P DJI — S&P500 overview
- Fama & French (2004), The Capital Asset Pricing Model: Theory and Evidence
- Frazzini & Pedersen (2014), Betting Against Beta
- Ledoit & Wolf (2004), Honey, I Shrunk the Sample Covariance Matrix
- State Street — SPY fund overview
- Yahoo Finance — adjusted price history; same history endpoint for each stock