Index funds are now a standard way to own the market, but individual stocks retain an enduring appeal. Investors may want dividends, a business they can follow, or a direct stake in a familiar company. Beating an index is not their only motivation.
The Japan Securities Dealers Association’s survey of 2025 NISA users found that domestic stocks accounted for 48.2% of 11,143 reported growth-quota holdings. Respondents reported their five largest purchases: this is a share of the count of holdings reported, not 48.2% of money invested. SBI Securities’ March 2026 figures show 35.0% using only the growth quota and 24.3% using both quotas. These are account-usage figures, not stock allocations; its domestic-stock purchase ranking also includes Nintendo and Mitsubishi UFJ FG.
We selected ten Japanese stocks already available on this site and calculated a stock basket with strong historical risk-adjusted performance. We then varied its cash allocation. The distinction matters: similar Sharpe ratios do not mean similar swings or similar amounts of money earned.
Results first: the medium-risk mix compared favorably with TOPIX
Weights were estimated using only 2010–2019 returns, then left unchanged as targets through 2020–2025. The lower-risk mix holds 60% stocks and 40% cash; the medium-risk mix holds 80% and 20%; the higher-risk mix is 100% stocks. The risk labels are relative to these three portfolios.
| Portfolio | CAGR | Annual volatility | Sharpe | Worst month-end drawdown |
|---|---|---|---|---|
| Lower-risk mix | 14.38% | 9.57% | 1.459 | -10.96% |
| Medium-risk mix | 19.21% | 12.72% | 1.453 | -14.61% |
| Higher-risk mix | 24.05% | 15.88% | 1.447 | -18.27% |
| Equal-weight stocks, 100% | 28.11% | 17.34% | 1.528 | -21.49% |
| TOPIX ETF (1306) | 14.70% | 13.02% | 1.123 | -17.46% |
| Nikkei 225 ETF (1321) | 15.40% | 17.32% | 0.916 | -19.26% |
The medium-risk mix produced a 19.21% CAGR, 12.72% annual volatility and a 1.453 Sharpe ratio. Its volatility was close to the TOPIX ETF’s 13.02%, while exceeding the ETF’s 14.70% CAGR and 1.123 Sharpe. The all-stock mix’s 15.88% volatility was higher than TOPIX’s. Concentrating in ten names did not itself make the portfolio safer; cash made the medium mix a more balanced comparison.
The lower-risk mix earned 14.38%, slightly below TOPIX, with volatility reduced to 9.57%. “Lower risk, higher return” is not a claim of maximum returns against every alternative. These are three different choices about how much equity exposure to hold.
Ten businesses, not simply ten ticker symbols
| Stock | Business exposure |
|---|---|
| Toyota Motor(7203) | Autos / mobility |
| Mitsubishi Heavy Industries(7011) | Aerospace / defense / power systems |
| Nintendo(7974) | Games / entertainment |
| Keyence(6861) | Factory automation / sensors |
| Shin-Etsu Chemical(4063) | Semiconductor materials / PVC |
| Hitachi(6501) | Digital / power grids / rail |
| Mitsubishi UFJ FG(8306) | Banking |
| Tokio Marine Holdings(8766) | Property / casualty insurance |
| Mitsubishi Corporation(8058) | Diversified trading / investment |
| INPEX(1605) | Oil / natural gas production |
Autos, industrial investment, entertainment, finance and resources bring different business exposures. They still share Japanese equity-market risk, overseas demand and currency influences. Different company names do not create independent returns.
The basket does not comprehensively cover pharmaceuticals, telecoms, utilities or the broader market. It is a large-company-heavy selection from the site’s current stock universe, not a miniature TOPIX. Optimization operates within that explicitly limited set.
Separate stock-basket efficiency from the amount of risk you hold
The methods used were constrained mean–variance optimization, fixed 20% diagonal covariance shrinkage and sequential least-squares quadratic programming (SLSQP). Inside the stock basket, each company must hold 3–25%; banking plus insurance is capped at 35%, as are Mitsubishi Heavy Industries plus Hitachi. There is no borrowing or shorting. We evaluated efficient allocations at 121 target-return levels and selected a mix near the highest estimated Sharpe.
After rounding the stock-basket weights to whole percentage points, the main holdings are Keyence 25%, Tokio Marine 25% and Hitachi 20%. Nintendo receives 7%, Shin-Etsu 8%, and the other five stocks 3% each. These are the results of the first decade’s returns and co-movement, not a dividend-yield ranking.
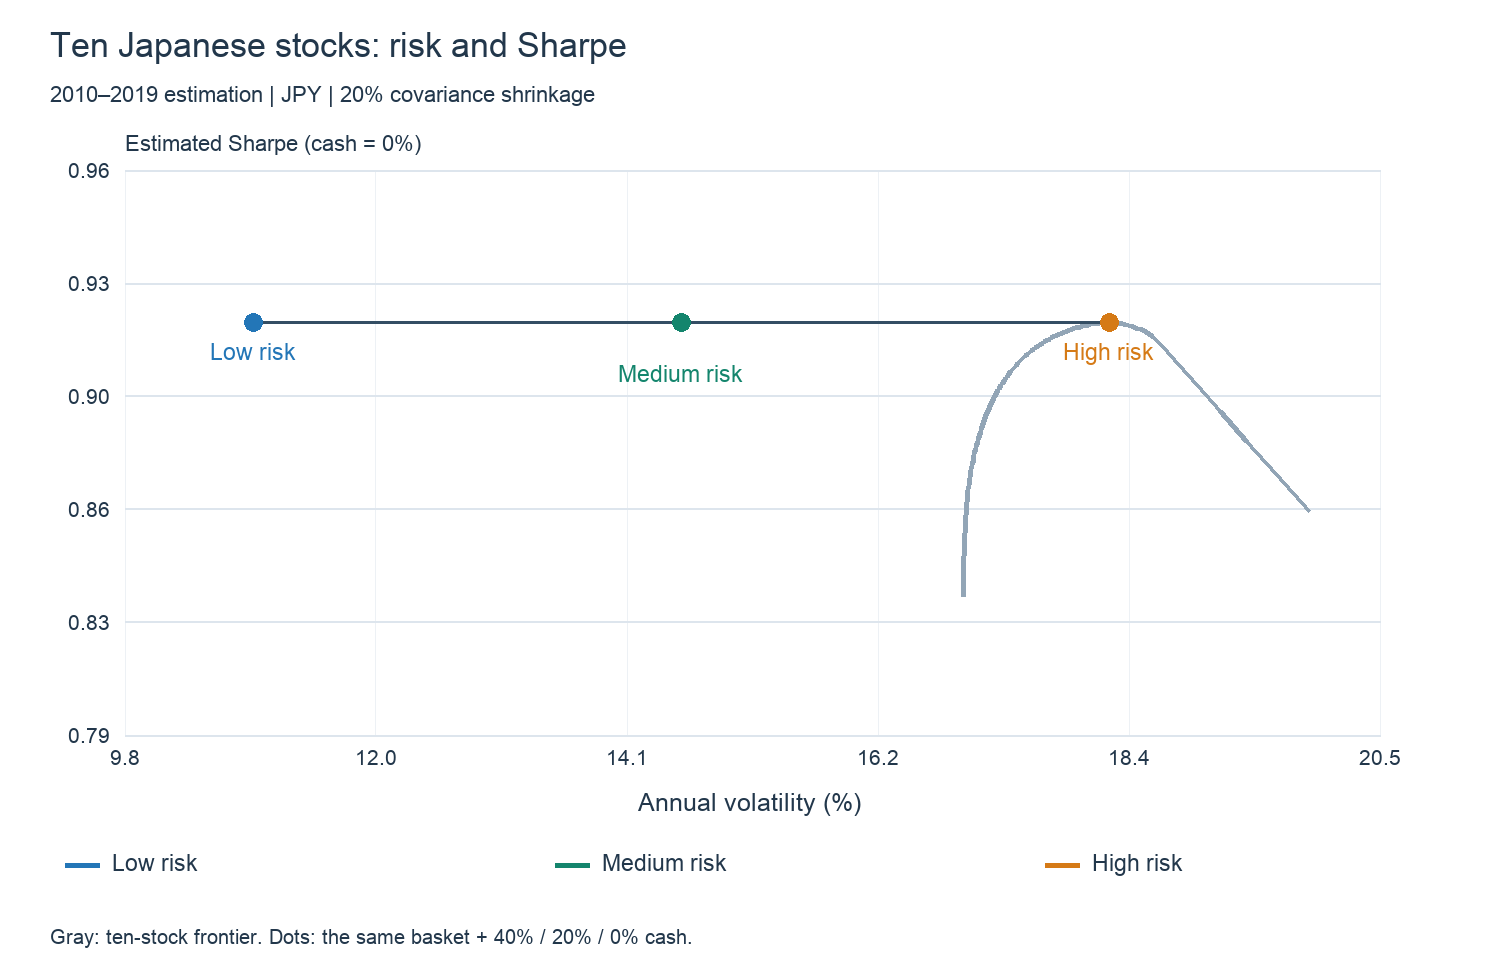
The gray curve shows candidates within a fully invested stock basket. Changing stock weights cannot reduce its risk indefinitely. Cash provides another lever: with zero interest and constant weights, holding 60% of the basket scales both its mean return and volatility to 60%, leaving their ratio unchanged. These three mixes use the same equity allocation at different portfolio sizes.
Quarterly weight drift makes the observed Sharpe ratios slightly different, but the 2020–2025 results—1.459, 1.453 and 1.447—remain close. Compare volatility and losses alongside Sharpe, rather than treating the three as interchangeable.
Implementable target allocations
| Holding | Lower-risk mix | Medium-risk mix | Higher-risk mix |
|---|---|---|---|
| Toyota Motor(7203) | 1.8% | 2.4% | 3% |
| Mitsubishi Heavy Industries(7011) | 1.8% | 2.4% | 3% |
| Nintendo(7974) | 4.2% | 5.6% | 7% |
| Keyence(6861) | 15% | 20% | 25% |
| Shin-Etsu Chemical(4063) | 4.8% | 6.4% | 8% |
| Hitachi(6501) | 12% | 16% | 20% |
| Mitsubishi UFJ FG(8306) | 1.8% | 2.4% | 3% |
| Tokio Marine Holdings(8766) | 15% | 20% | 25% |
| Mitsubishi Corporation(8058) | 1.8% | 2.4% | 3% |
| INPEX(1605) | 1.8% | 2.4% | 3% |
| Cash | 40% | 20% | 0% |
| Total | 100% | 100% | 100% |
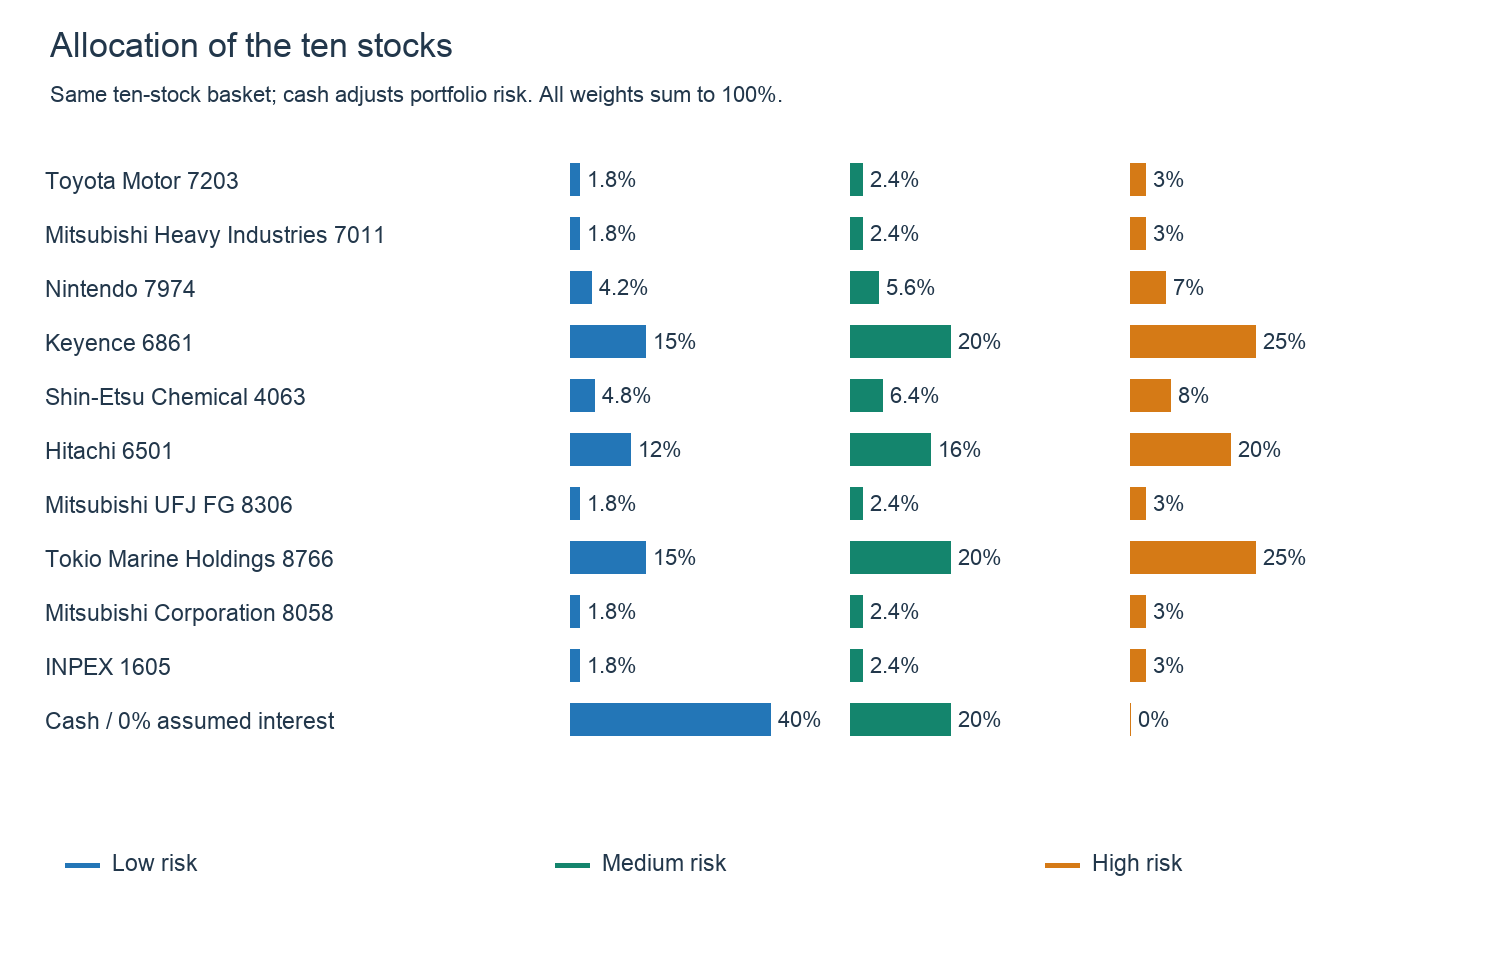
For a ¥1 million medium-risk portfolio, the central allocations are ¥200,000 cash, ¥200,000 Keyence, ¥200,000 Tokio Marine and ¥160,000 Hitachi. The lower-risk version holds ¥600,000 of the same basket and ¥400,000 cash. Cash is a permanent allocation, not a reserve to spend completely whenever stocks fall. Using it all changes the strategy.
Keep the estimation period separate from subsequent results
| Portfolio | CAGR | Annual volatility | Sharpe | Worst month-end drawdown |
|---|---|---|---|---|
| Lower-risk mix | 9.82% | 11.77% | 0.857 | -17.46% |
| Medium-risk mix | 12.85% | 15.70% | 0.852 | -23.04% |
| Higher-risk mix | 15.73% | 19.62% | 0.846 | -28.49% |
| Equal-weight stocks, 100% | 11.07% | 19.75% | 0.632 | -35.02% |
| TOPIX ETF (1306) | 8.80% | 16.57% | 0.593 | -24.01% |
| Nikkei 225 ETF (1321) | 10.26% | 17.28% | 0.654 | -23.06% |
The higher-risk mix’s 2010–2019 CAGR was 15.73%, with a 0.846 Sharpe. That period also supplied the allocation estimates, so favorable results there are not sufficient evidence. The subsequent-period results at the beginning of this article are the more informative comparison.
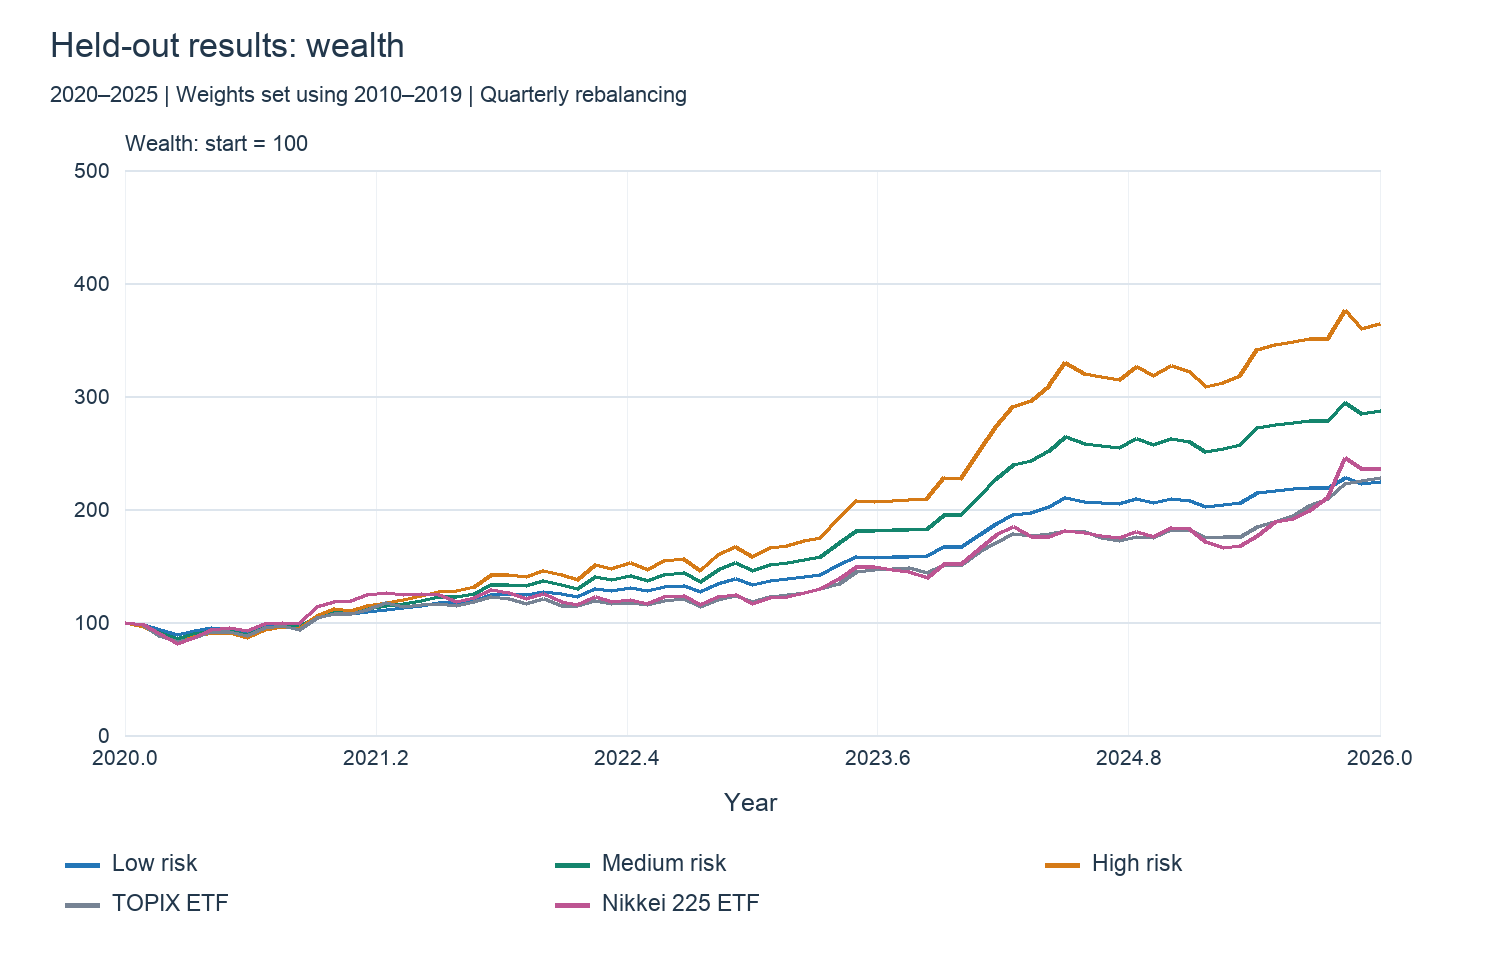
Starting from 100 at end-2019, terminal wealth was 223.9, 287.1 and 364.5 for the lower-, medium- and higher-risk mixes. More cash reduced upside participation; the next chart shows the corresponding reduction in drawdowns.
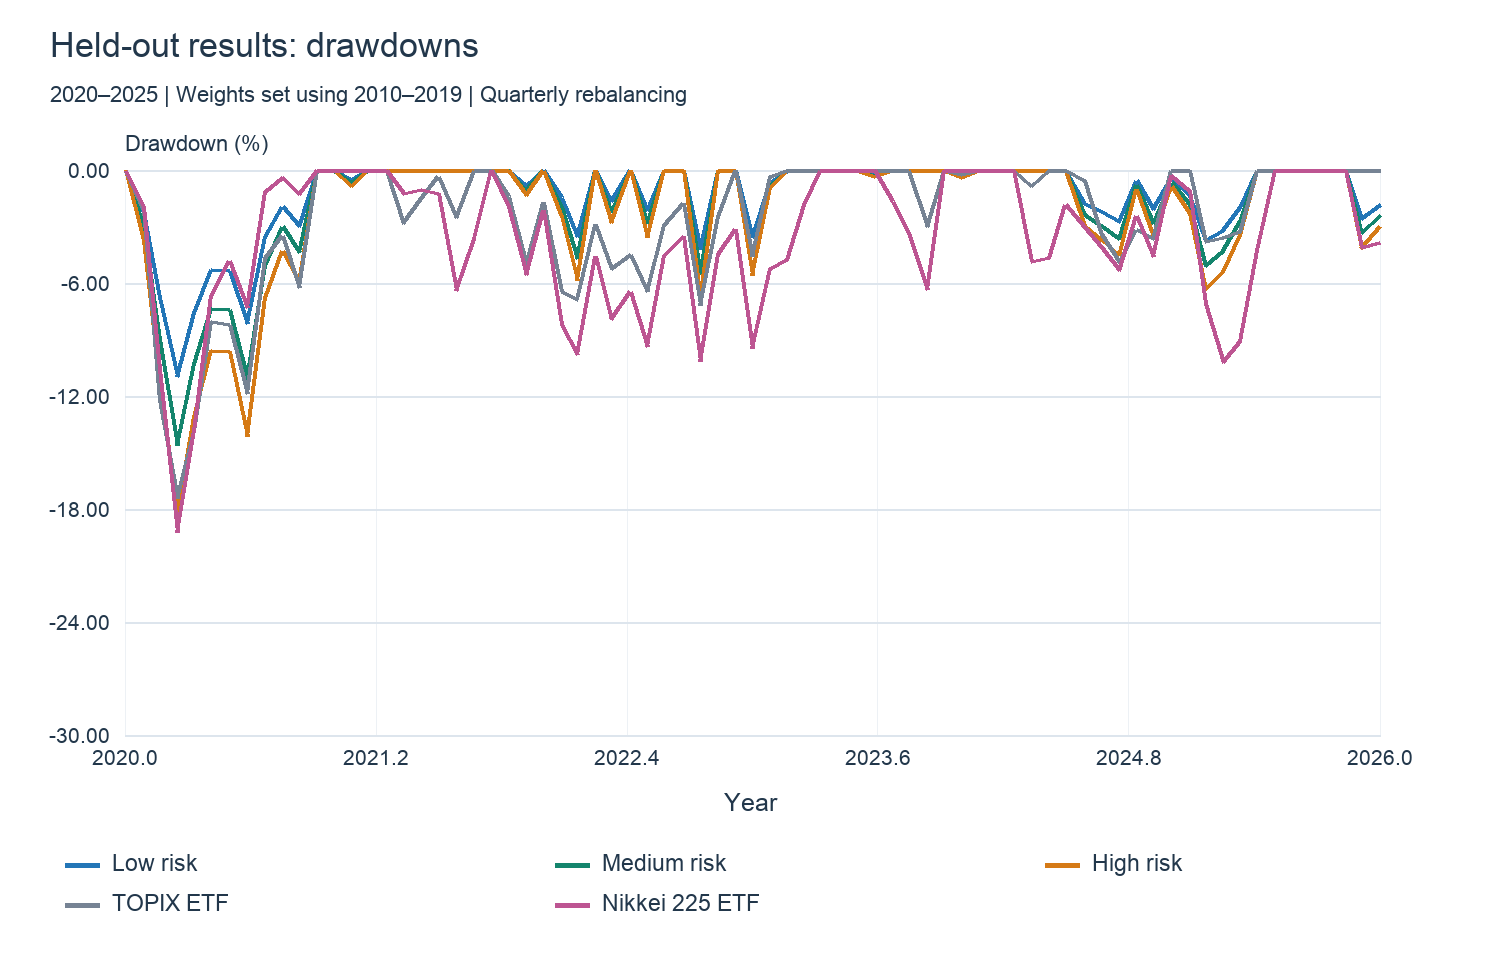
Worst month-end drawdowns were -10.96%, -14.61% and -18.27%. Annual volatility is not a maximum-loss limit. These drawdowns are measured at month-end and do not capture deeper falls within a month. Risk-adjusted efficiency and the burden of an actual decline are different measures.
Optimization did not beat equal weighting every time
In 2020–2025, putting 10% in each of the ten stocks produced a 28.11% CAGR and 1.528 Sharpe, beating the optimized all-stock basket. Refining historical weights did not identify the subsequent period’s best portfolio.
Mitsubishi Heavy Industries, for example, received just 3% from the earlier-period estimates but performed strongly later; equal weighting held 10%. Keyence received 25% in the optimized basket versus 10% in equal weighting. Changes in market leadership alter the comparison. Optimization supplies a constrained, measurable basket and a target to manage, not advance knowledge of the next winners.
Rebalance quarterly—or test whether annual maintenance is sufficient
The base strategy resets stocks and cash to target weights at March, June, September and December month-ends. Calculate each holding’s value as a share of the entire portfolio, then the money needed to restore its target. Direct new contributions and cash dividends toward underweight holdings before selling overweight positions.
| Maintenance | CAGR | Annual volatility | Sharpe |
|---|---|---|---|
| Quarterly | 19.21% | 12.72% | 1.453 |
| Annually | 19.72% | 12.53% | 1.508 |
| No rebalancing | 20.77% | 14.02% | 1.425 |
| Quarterly + 0.1% of traded stock value | 19.18% | 12.72% | 1.451 |
For the medium-risk mix, annual rebalancing produced a 1.508 Sharpe in 2020–2025, versus 1.453 for quarterly rebalancing. Not rebalancing increased returns but raised volatility to 14.02%. Rebalancing is about restoring chosen exposure, not always increasing returns. Annual maintenance is a practical alternative when four checks per year are too demanding.
The table assumes fractional shares. Real Japanese shares normally trade in lots, and even odd-lot services cannot match every target yen exactly. Check execution timing and trading costs and avoid forcing insignificant rounding differences. Taxes in taxable accounts require separate treatment. In NISA, sold acquisition-cost capacity becomes reusable from the following year, subject to annual purchase limits; selling does not automatically permit an immediate repurchase of the same amount. Cash can sit outside NISA.
Once a year, also review company disclosures, major business changes, mergers and possible delistings. If the universe changes, redesign using information available at that point and record the date and weights. Do not rerun the allocation merely because a different company led the previous month.
Use the board to understand the basket
Place TOPIX and the Nikkei 225 beside Keyence, Tokio Marine and Hitachi. When the indexes fall, are all three companies moving together, or are insurance and investment-related businesses showing different strength? That comparison helps explain the portfolio’s exposures.
Use printed percentage changes and percentage reference lines, not chart slopes. A single day of opposite movement does not establish diversification or justify a weight change. The board separates understanding the holdings from continually trading them.
My starting point would be the medium-risk mix
For this ten-stock exercise, I would start with 80% equities and 20% cash. In the subsequent period it combined TOPIX-like volatility with higher risk-adjusted returns and smaller swings than the all-stock basket. Move to 60/40 for less equity exposure, or 100/0 to accept the full basket’s fluctuations. Choosing a mix that can be maintained through declines matters more than another decimal place of historical Sharpe.
Data and calculation
The study uses 192 month-end returns from January 2010 through December 2025, with a December 30, 2009 baseline. Stocks use split- and dividend-adjusted closes, sampled only on actual month-end trading observations; missing and zero-volume placeholder quotes are not filled. TOPIX and Nikkei comparisons use NEXT FUNDS 1306 and 1321 official dividend-reinvestment NAVs, including fund expenses—not raw price indexes.
Allocation estimation uses 120 months in 2010–2019; target weights remain fixed for 72 subsequent months in 2020–2025. The universe is selected from stocks listed on this site in 2026, rather than reconstructed from all companies available at a historical date. The weights have a time-separated evaluation, but the exercise is not a contemporaneous live record of historical stock selection.
CAGR is geometric annual growth. Volatility is sample monthly-return standard deviation times √12. Sharpe is mean monthly excess return divided by its sample standard deviation, times √12. Cash earns 0% and the risk-free benchmark is 0%. Subtracting a 1% annual reference rate changes subsequent-period Sharpe to 1.355, 1.375 and 1.384. The estimation chart uses shrunk covariance and constant-weight theory; tables use realized quarterly-rebalanced holdings, so the two need not match.
Dividends are reinvested. Base tables exclude personal taxes, commissions and spreads. The cost test charges 0.1% on the combined stock value bought and sold at each rebalance, not on cash transfers. Maintenance alternatives all restart from their target weights at end-2019. Calculated October 15, 2026. This is a JPY analysis of Japanese holdings, not a USD-return comparison.
Data and references
- JSDA — 2025 NISA user survey (revised September 2026), pp. 6–7
- SBI Securities — FY March 2026 results, p. 14
- NEXT FUNDS — TOPIX ETF (1306)
- Nomura Asset Management — 1306 historical dividend-reinvestment NAV
- NEXT FUNDS — Nikkei 225 ETF (1321)
- Nomura Asset Management — 1321 historical dividend-reinvestment NAV
- Yahoo Finance — historical stock prices; the same adjusted-close field for all ten stocks
- Financial Services Agency — NISA rules