US equities have become a natural starting point for investors on both sides of the Pacific. S&P500 funds feature in SBI Securities’ 2025 popularity rankings. In the US, ICI’s 2025 Fact Book reports that domestic equity funds received 45% of index-fund inflows over the preceding decade through 2024.
Deep capital markets, globally competitive businesses and technology earnings help explain that appeal. According to S&P Dow Jones Indices, the Magnificent Seven accounted for 53.1% of the S&P500’s 2024 total return. The US is not the birthplace of capitalism or securities markets; it built today’s leading market on institutions with earlier European roots.
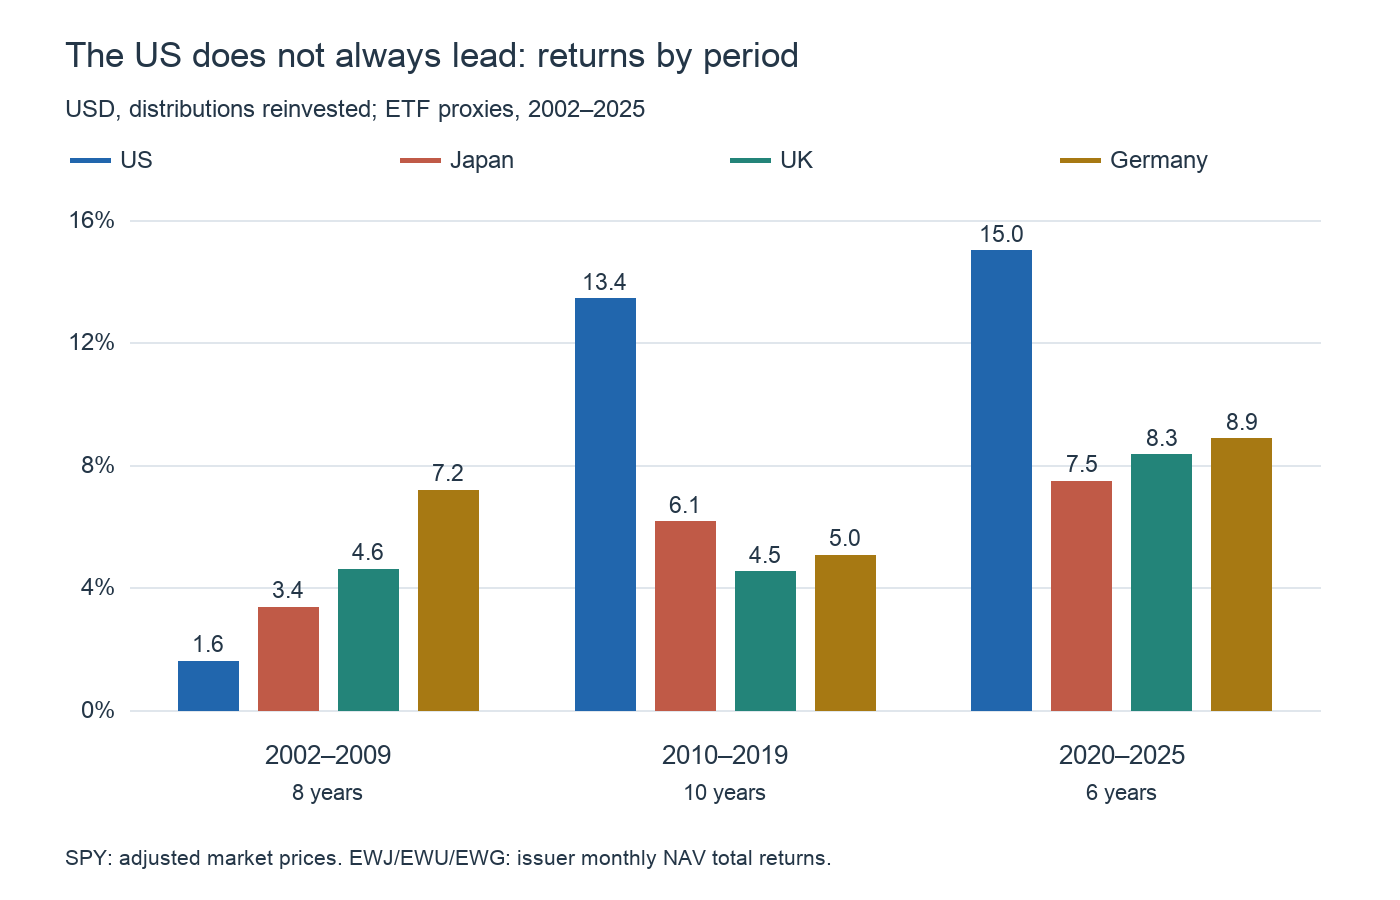
But leadership has not been permanent. In our comparison of US, Japanese, British and German equity ETFs, Germany ranked first and the US last in 2002–2009. The US moved into first place in the 2010s. A strong long-term market need not win from every starting date.
Four markets, one currency, reinvested distributions
We use investable country ETF proxies rather than mixing national price indexes. All returns are in US dollars, with distributions reinvested and fund expenses reflected.
| Market | Proxy | Return series |
|---|---|---|
| US | SPY / S&P 500 | Adjusted market price |
| Japan | EWJ / MSCI Japan | Monthly NAV total return |
| UK | EWU / MSCI United Kingdom | Monthly NAV total return |
| Germany | EWG / MSCI Germany | Monthly NAV total return |
EWJ, EWU and EWG use issuer-published monthly NAV total returns. SPY uses monthly returns calculated from cached distribution- and split-adjusted market prices. NAV is net asset value per share, not the exchange price. This is a comparison of ETF investment results, not identical valuation conventions or theoretical index returns.
The first full common calendar year in the available official monthly histories is 2002. We therefore compare eight years in 2002–2009, ten in 2010–2019 and six in 2020–2025. The last interval is not a completed decade. Annualized returns make the different lengths easier to compare. Four developed markets do not represent every world market or establish rankings for China and emerging economies.
2002–2009: the US ranked last
| Rank | Market / ETF | Annualized return | Total return | Annualized risk |
|---|---|---|---|---|
| 1 | Germany / EWG | 7.17% | 74.05% | 26.19% |
| 2 | UK / EWU | 4.60% | 43.32% | 17.46% |
| 3 | Japan / EWJ | 3.35% | 30.21% | 17.73% |
| 4 | US / SPY | 1.59% | 13.46% | 15.53% |
Germany returned 7.17% annually, the UK 4.60%, Japan 3.35% and the US 1.59%. Germany’s cumulative gain was approximately 74%, against 13% for the US. Our sample begins during the technology-bubble unwind, not at its 2000 starting point.
The interval combines the aftermath of the technology boom, recovery from 2003 and the 2008 financial crisis. Federal Reserve researchers document the boom and reversal in US technology investment. Currency also matters: the ECB’s June 2003 review records substantial euro appreciation during 2002 and early 2003. Dollar returns on German equities include changes in the euro as well as local equity performance.
Germany’s annualized volatility was 26.19%, compared with 15.53% for the US. Better returns came with larger fluctuations, not a painless alternative to US equities.
2010–2019: a clear US lead
| Rank | Market / ETF | Annualized return | Total return | Annualized risk |
|---|---|---|---|---|
| 1 | US / SPY | 13.44% | 252.76% | 12.44% |
| 2 | Japan / EWJ | 6.14% | 81.46% | 12.91% |
| 3 | Germany / EWG | 5.05% | 63.63% | 19.74% |
| 4 | UK / EWU | 4.51% | 55.43% | 15.12% |
The US moved to first place with a 13.44% annualized return and an approximately 253% cumulative gain. Japan ranked second at 6.14%, followed by Germany at 5.05% and the UK at 4.51%. Avoiding the US solely because of its earlier weak period would have missed a substantial subsequent advance.
Smartphones, cloud computing and digital advertising provided major earnings opportunities for US businesses. In the UK, sterling fell sharply after the 2016 EU referendum, as the Bank of England’s contemporary report records. Industry composition, earnings, valuations and currency all influence dollar results. One event alone does not explain a decade’s performance gap.
2020–2025: leading the period is not winning every year
| Rank | Market / ETF | Annualized return | Total return | Annualized risk |
|---|---|---|---|---|
| 1 | US / SPY | 14.99% | 131.21% | 17.13% |
| 2 | Germany / EWG | 8.86% | 66.47% | 22.52% |
| 3 | UK / EWU | 8.33% | 61.59% | 17.61% |
| 4 | Japan / EWJ | 7.47% | 54.10% | 15.28% |
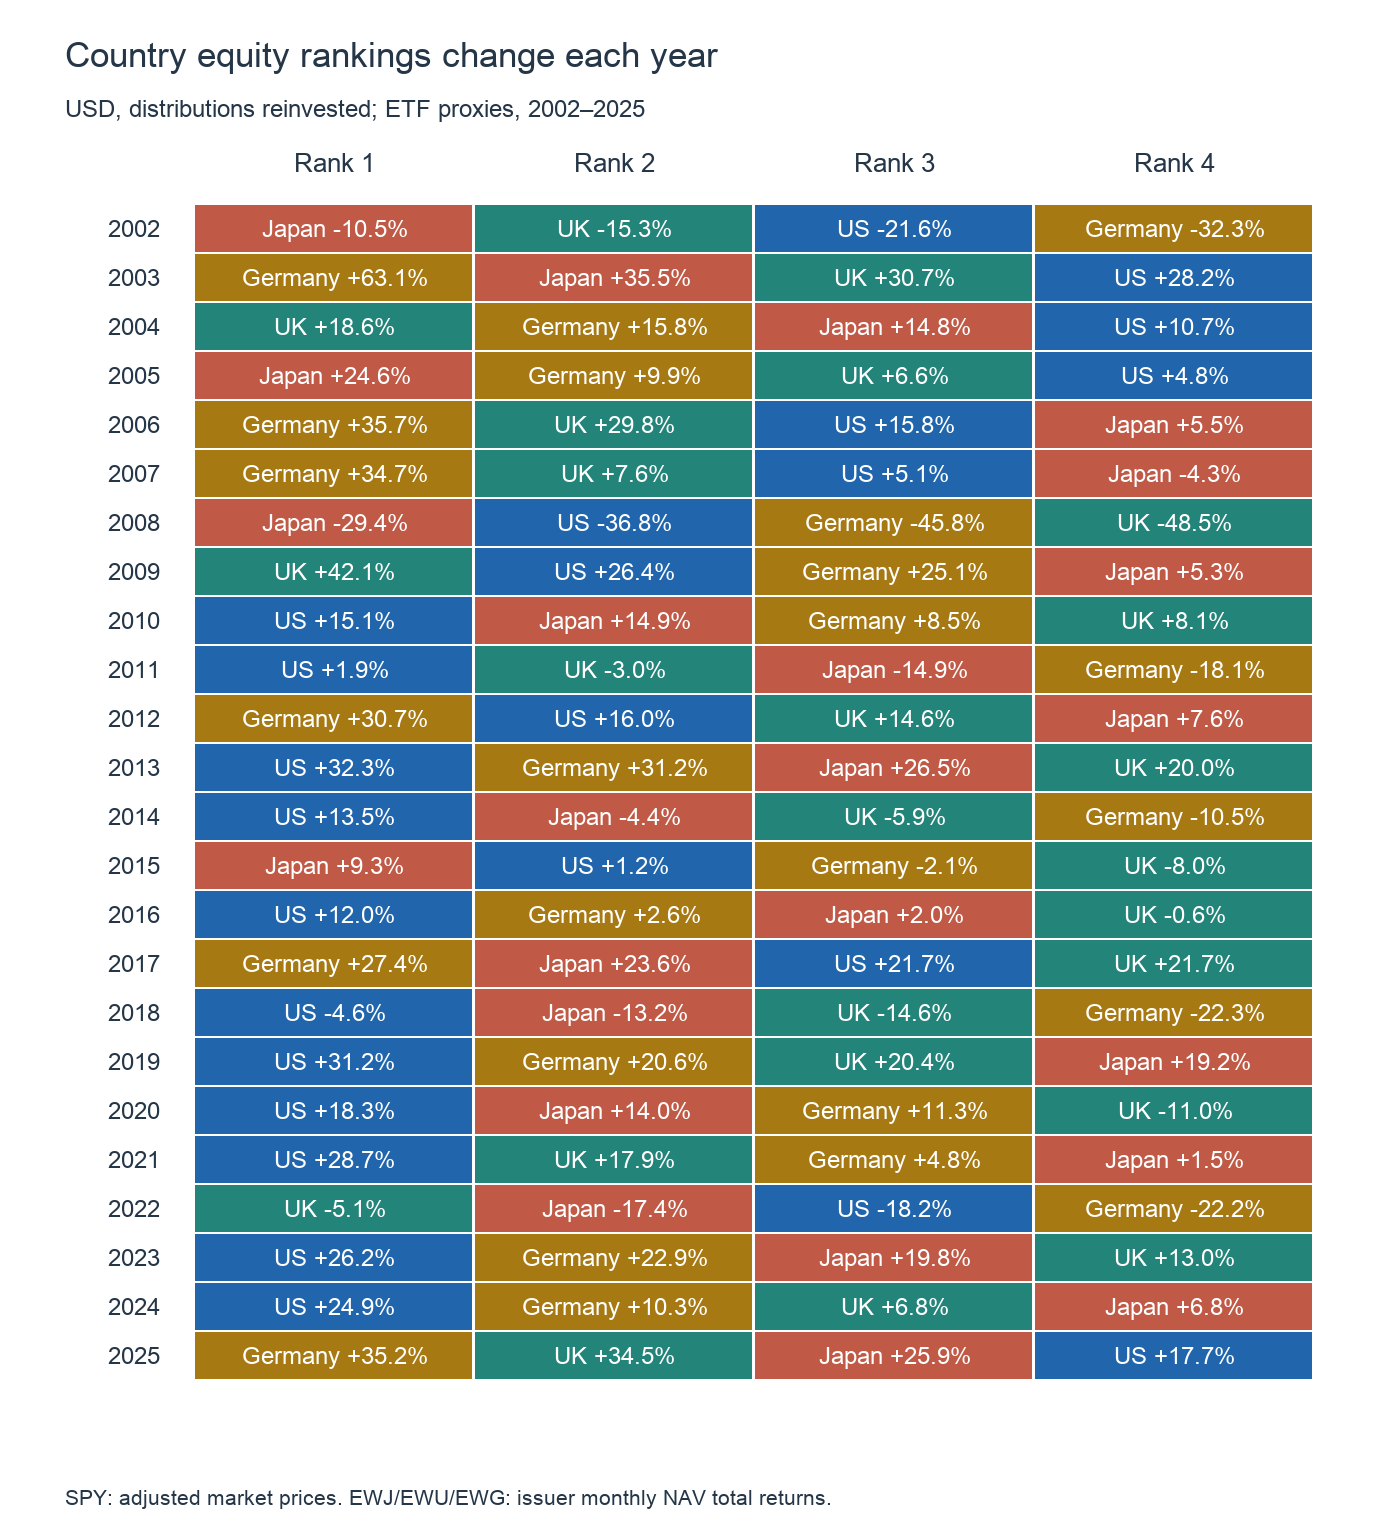
The US again ranked first, at 14.99% annually, followed by Germany at 8.86%, the UK at 8.33% and Japan at 7.47%. Large technology and AI-related companies were an important part of the US advance. Yet the UK led in 2022 and Germany in 2025. The US ranked last among these four in 2025.
Japan’s last-place result over the six-year interval does not mean Japanese share prices never rose. EWJ is measured in dollars: yen weakness can offset gains in yen-denominated stocks. Currency and dividends should be checked before comparing this table with domestic index headlines.
| Market | Years ranked first |
|---|---|
| US | 11 / 24 |
| Japan | 4 / 24 |
| UK | 3 / 24 |
| Germany | 6 / 24 |
The US led in 11 of the 24 individual years, Japan in four, the UK in three and Germany in six. The US won the full-period compound-return comparison while leading in fewer than half the individual years. Japan’s first place in 2008 meant the smallest loss, not a positive return. A ranking and an absolute gain are different facts.
Before these ETFs: Japan once had the largest equity market
The UBS Global Investment Returns Yearbook 2024 discusses Japan becoming the world’s largest equity market at the end of the 1980s. Market size is not the same as investment return, but the episode shows why today’s dominant country should not be treated as a permanent fixture.
The subsequent asset-price collapse and adjustment are part of the Bank of Japan’s retrospective analysis. Owning excellent companies in a successful country does not overcome every starting valuation. Economic success and investment success from a particular purchase date need not coincide.
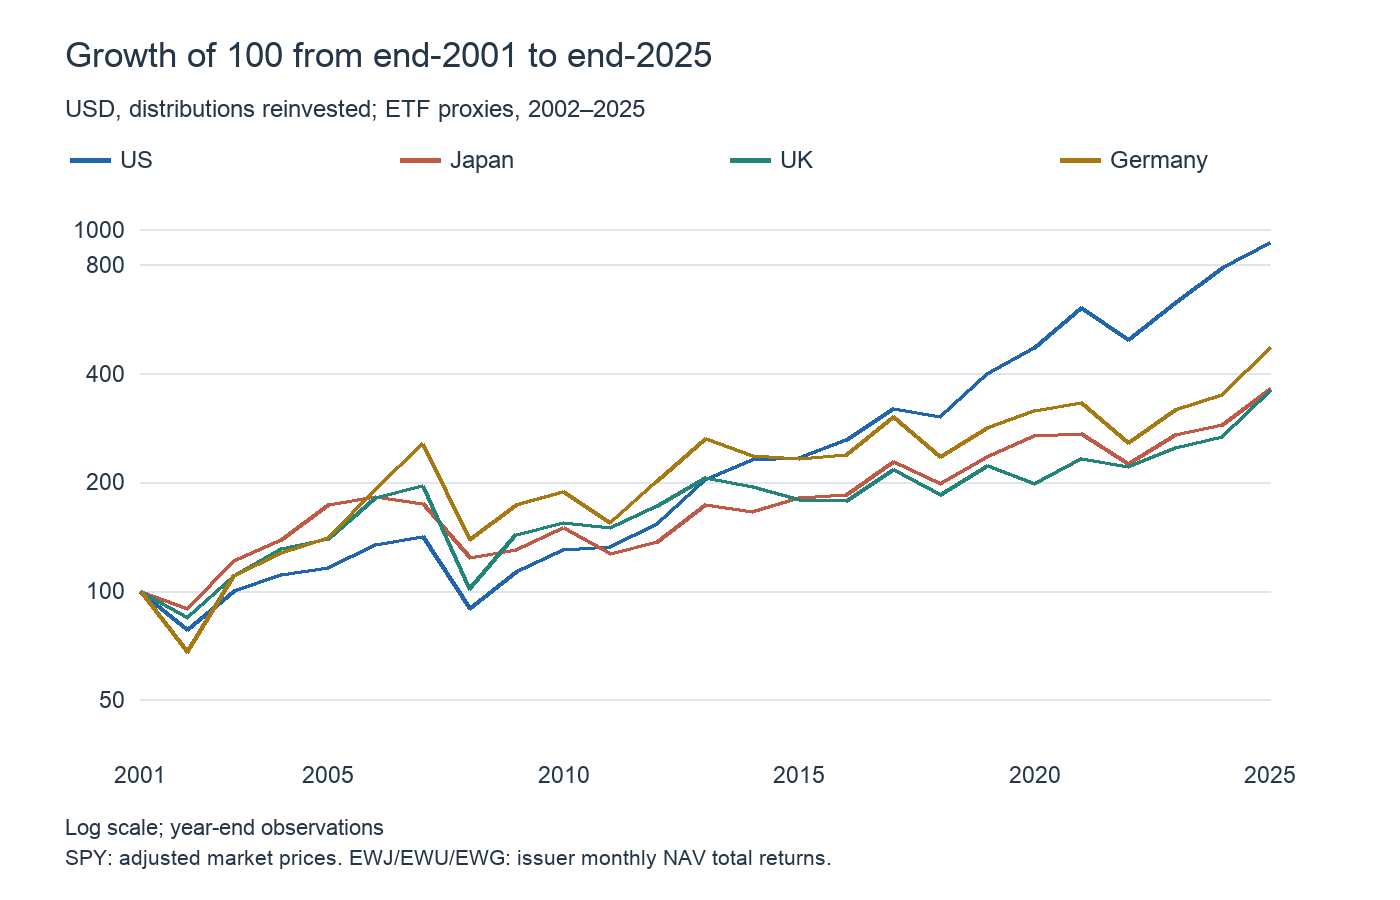
Our own full-period results still favor the US. Starting with 100 at end-2001, the end-2025 values are approximately 925 for the US, 474 for Germany, 364 for Japan and 360 for the UK. “The US does not always win” is not evidence that excluding it is a superior strategy.
Return leadership and risk characteristics are different
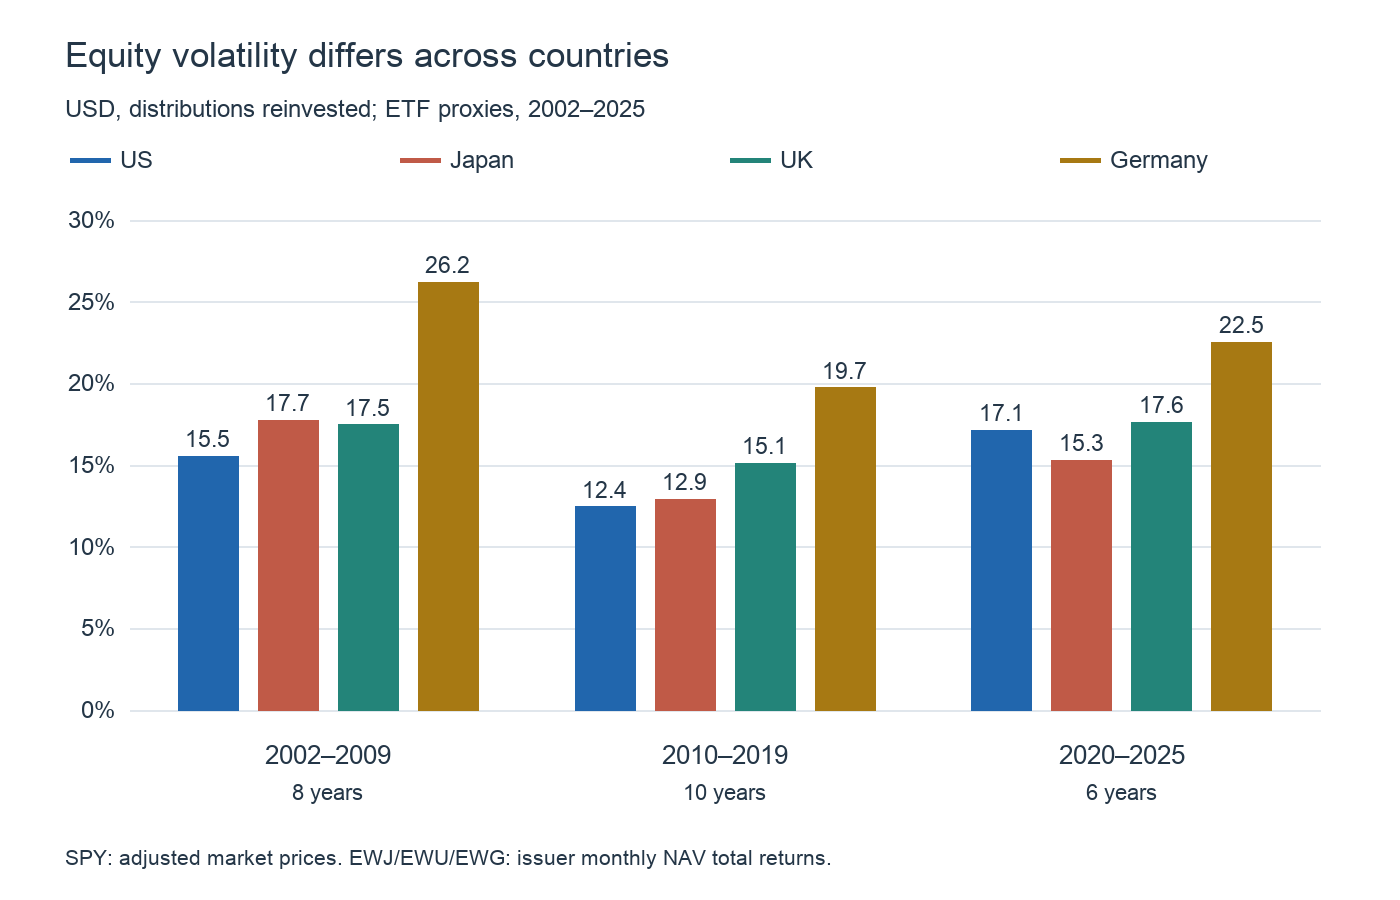
Germany had the highest monthly-based annualized volatility in all three intervals. Japan was close to or below the US in the 2010s and 2020–2025. Country labels alone are not enough to assign risk; use a consistent currency, frequency and period.
Across the 23 adjacent-year pairs, average correlation between annual volatility rankings was 0.65. Relative volatility showed persistence, but each annual estimate uses only 12 monthly observations. This does not lock in next year’s volatility. See our analysis of past data and risk prediction for the distinction between persistent rankings and changing levels.
Use the board to separate region and currency
Compare the S&P500, TOPIX, DAX and FTSE100 to follow daily regional differences. The board’s indexes differ in local currency, dividend convention and trading hours; they do not reproduce this ETF study. Add USD/JPY, EUR/USD and GBP/USD to distinguish equity moves from exchange-rate changes.
Observe percentage changes and intraday swings over several days. A daily endpoint return is not the total amount of intraday movement, and one day cannot determine long-term volatility. Use long-run statistics for allocation and the board to notice changes.
The US remains a major investment opportunity. Its strength does not establish that it must beat other markets over the next decade. Regional diversification is less about guessing the next winner than maintaining an allocation that can survive a change in leadership.
Calculation details
288 months, January 2002–December 2025. SPY uses month-end observations from cached adjusted daily closes. EWJ, EWU and EWG use Monthly Total (NAV) Return from the issuers’ downloadable Performance worksheets. Published monthly returns are rounded, so compounding can differ slightly from published annual figures. Annualized return is the product of monthly (1+r), raised to one divided by the number of years, minus one. Annualized risk is sample standard deviation of monthly simple returns multiplied by √12. Annual winners are selected from the four calendar-year compound returns. Fund expenses are already reflected. No personal taxes, trading costs, yen conversion or inflation adjustment. Unhedged non-US returns include exchange-rate changes against the dollar. These four currently selected markets are not a search for the best or worst market worldwide. MSCI country ETF benchmarks are not identical to TOPIX, DAX or FTSE100.
Data and references
- SBI Securities: 2025 annual popularity rankings
- ICI: 2025 Investment Company Fact Book, p.29
- S&P DJI: Market Attributes, January 2025, p.3
- UBS: Global Investment Returns Yearbook 2024
- Bank of Japan: Japan’s Economy and Prices over the Past 25 Years
- Federal Reserve: Macroeconomic Overheating and Financial Vulnerability
- ECB: Euro effective exchange rate developments, June 2003
- Bank of England: Inflation Report, August 2016
- State Street: SPY fund information
- iShares: EWJ monthly NAV total returns
- iShares: EWU monthly NAV total returns
- iShares: EWG monthly NAV total returns
- Yahoo Finance: previously cached SPY adjusted prices