Warren Buffett, Charlie Munger and Benjamin Graham are familiar names to long-term investors. Each made the relationship between business value and purchase price central to investing. But value investing is not synonymous with buying the highest dividend yield. In Berkshire’s 1989 shareholder letter, Buffett explained the appeal of exceptional businesses at sensible prices and credited Munger with appreciating that distinction early.
SCHD, VTV and VYM turn different parts of that idea into index rules: valuation, dividends and financial quality. Our distribution-reinvested comparison from October 2011 through September 2026 finds CAGRs of 13.08%, 13.05% and 12.36%, respectively. SCHD and VTV finish almost together, but take noticeably different routes.
Why Japanese investors welcomed access to SCHD
SCHD launched in 2011, but direct access through major Japanese brokers was limited. Rakuten’s September 2024 announcement explained that the ETF lacked the Japanese registration needed for straightforward local distribution. A domestic mutual fund provided a new route into a familiar U.S. dividend strategy.
The Rakuten fund was established on September 18, 2024, with sales beginning September 27. Assets passed ¥30 billion within 26 days. An SBI fund followed in December, attracting more than ¥59.6 billion in initial subscriptions. These are concrete measures of Japanese interest. Rakuten’s range now also includes an accumulation-oriented version alongside its quarterly-distribution fund.
VYM and VTV had offered established alternatives. Easier access to SCHD did not make their strategies obsolete: a new distribution channel is not evidence of a superior investment rule.
Three ETFs, three selection rules
| Item | SCHD | VTV | VYM |
|---|---|---|---|
| Manager | Schwab Asset Management | Vanguard | Vanguard |
| ETF inception | 2011-10-20 | 2004-01-26 | 2006-11-10 |
| Primary exposure | Dividend quality and durability | U.S. large-cap value | U.S. high-dividend stocks |
| Benchmark | Dow Jones U.S. Dividend 100 | Morningstar US Large Cap Value (formerly CRSP) | FTSE High Dividend Yield |
| Selection | Dividend record, yield, financial strength and growth | Book value, earnings, sales and dividends relative to price | Screen on forecast dividend yield |
| Weighting | Capped market-cap weights | Float-adjusted market-cap weights | Market-cap weights |
| Holdings | 100 index stocks / 102 fund holdings¹ | 308² | 605² |
| ETF net assets (USD bn) | 112.83¹ | 186.11² | 78.99² |
| Annual expense ratio | 0.06% | 0.03% | 0.04% |
| Distribution frequency | Quarterly | Quarterly | Quarterly |
¹SCHD holdings and assets: October 14, 2026. ²VTV and VYM: June 30, 2026 issuer factsheets. Assets cover the ETF, not other share classes of the underlying fund. Different observation dates make these scale comparisons rather than same-day rankings. Expense ratios are annual issuer figures.
With approximately $186 billion in VTV, $113 billion in SCHD and $79 billion in VYM, all three have substantial U.S.-listed ETF assets. Assets show market adoption, not a count of admirers or investor accounts. Vanguard manages VTV and VYM; Schwab Asset Management manages SCHD. All three use low-cost index strategies.
VTV also has a new formal name. On July 29, 2026, Vanguard Value ETF became Vanguard Morningstar Value ETF following the rebranding of CRSP indexes. Vanguard said the change did not alter investment objectives or management. It is not a new strategy beginning in 2026.
VTV: valuation, without requiring high dividends
VTV targets U.S. large-cap value through multiple measures: book value, forward and historical earnings, dividends and sales relative to price. It then uses float-adjusted market-cap weights. This is broader than a low-P/E ranking, and dividends are one input rather than the objective.
Berkshire Hathaway’s place among its leading holdings illustrates the distinction. A company can reinvest capital internally and still belong in a value portfolio. VTV is a way to hold a broad valuation segment, not a dedicated instrument for maximizing cash distributions.
VYM: a broad dividend-yield screen
VYM tracks the FTSE High Dividend Yield Index, emphasizing higher forecast dividend yields and weighting holdings by market capitalization. REITs are excluded. Its 605 holdings in June 2026 represent a much broader selection than SCHD’s dividend-history and financial-quality process.
More holdings do not mean equal weights. Broadcom represented 7.3% of VYM at that date. A dividend ETF can have meaningful semiconductor exposure; its label does not remove technology risk.
SCHD: dividend history and the capacity to pay
SCHD’s index requires at least ten consecutive years of dividend payments, then combines yield, free cash flow relative to debt, return on equity and five-year dividend growth to select roughly 100 stocks. It excludes REITs and uses capped market-cap weights, with 4% stock and 25% sector limits at scheduled weight resets. Market moves can subsequently push holdings above those limits.
Ten years of payments is not a requirement for ten consecutive annual dividend increases. The process screens for particular characteristics; it does not guarantee uninterrupted dividends. A narrower selection also creates more opportunity to diverge from the broader value universe.
| ETF | Top holdings / weight / date |
|---|---|
| SCHD | Texas Instruments 4.54% / Procter & Gamble 4.37% / Chevron 4.32% (2026-10-14) |
| VTV | Micron 4.9% / Berkshire Hathaway 3.5% / JPMorgan Chase 3.1% (2026-06-30) |
| VYM | Broadcom 7.3% / JPMorgan Chase 3.4% / Johnson & Johnson 2.5% (2026-06-30) |
These dated holdings illustrate the differences in current portfolios, not their composition in every past year. Buying all three means buying overlapping U.S. stocks under different selection rules.
Nearly fifteen years: similar endpoints, different paths
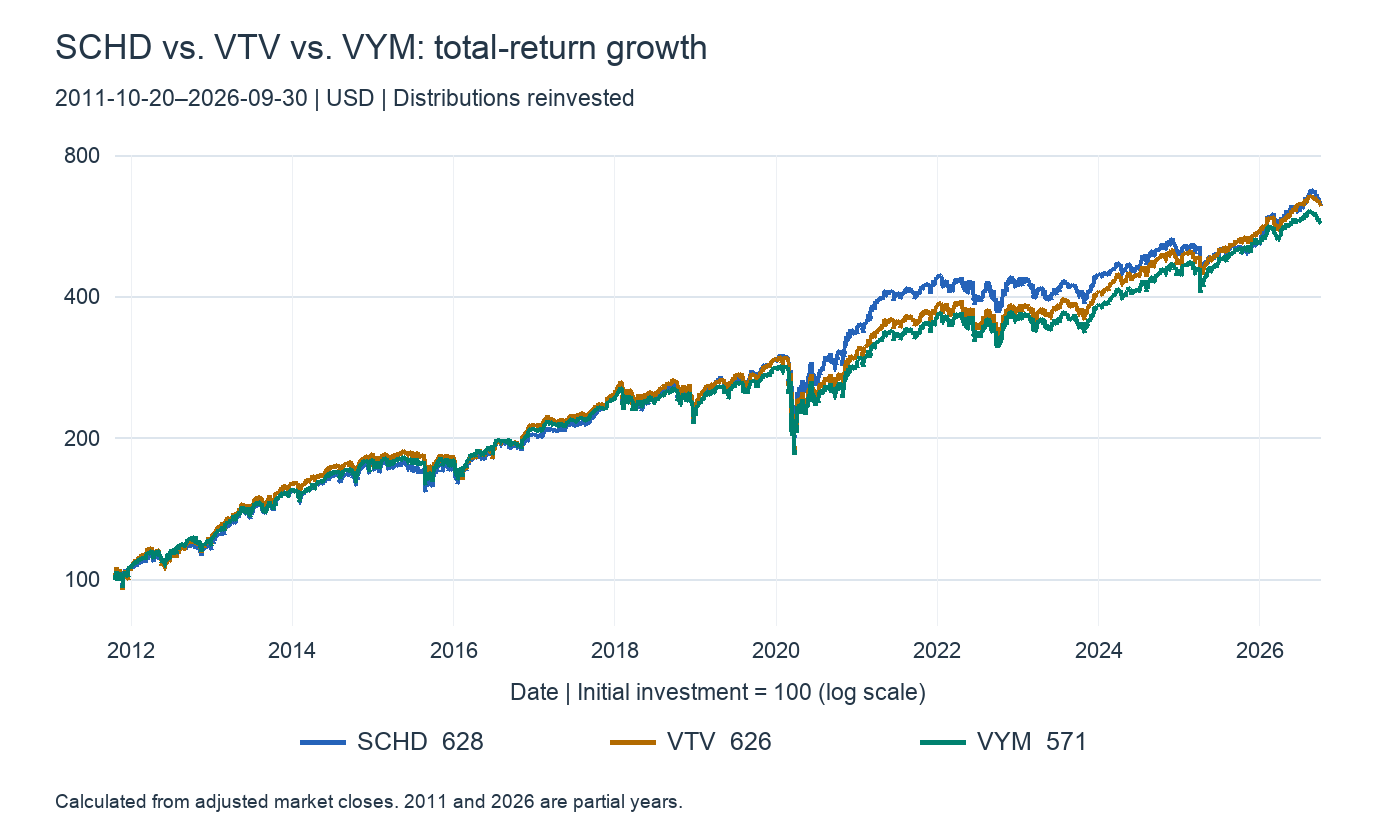
An initial 100 grows to 628 in SCHD, 626 in VTV and 571 in VYM. The logarithmic axis makes equal slopes represent equal proportional growth. Full-sample annual volatility is 15.35%, 15.69% and 15.12%; Sharpe ratios are 0.773, 0.758 and 0.740.
SCHD leads the full-sample Sharpe comparison, but its CAGR advantage over VTV is only about 0.03 percentage points. I read this as different designs reaching similar endpoints, not a decisive SCHD victory. The experience of owning them lies in the intervening gaps.
Results by period
Full sample: October 2011–September 2026
| ETF | Total return | CAGR | Annual risk | Sharpe | Max drawdown |
|---|---|---|---|---|---|
| SCHD | 528.09% | 13.08% | 15.35% | 0.773 | -33.37% |
| VTV | 525.51% | 13.05% | 15.69% | 0.758 | -36.78% |
| VYM | 470.83% | 12.36% | 15.12% | 0.740 | -35.21% |
October 2011–December 2019
| ETF | Total return | CAGR | Annual risk | Sharpe | Max drawdown |
|---|---|---|---|---|---|
| SCHD | 193.63% | 14.04% | 11.97% | 1.105 | -17.08% |
| VTV | 194.01% | 14.06% | 12.93% | 1.034 | -17.36% |
| VYM | 182.13% | 13.49% | 11.95% | 1.066 | -16.25% |
2020–2025
| ETF | Total return | CAGR | Annual risk | Sharpe | Max drawdown |
|---|---|---|---|---|---|
| SCHD | 76.04% | 9.88% | 19.37% | 0.443 | -33.37% |
| VTV | 85.24% | 10.82% | 19.27% | 0.489 | -36.78% |
| VYM | 83.84% | 10.68% | 19.01% | 0.487 | -35.21% |
2022: a down year
| ETF | Total return | CAGR | Annual risk | Sharpe | Max drawdown |
|---|---|---|---|---|---|
| SCHD | -3.26% | -3.27% | 18.84% | -0.172 | -16.84% |
| VTV | -2.09% | -2.09% | 18.70% | -0.110 | -17.04% |
| VYM | -0.43% | -0.44% | 18.37% | -0.024 | -15.84% |
2023–2025: three years of SCHD underperformance
| ETF | Total return | CAGR | Annual risk | Sharpe | Max drawdown |
|---|---|---|---|---|---|
| SCHD | 21.80% | 6.79% | 13.49% | 0.205 | -16.12% |
| VTV | 46.11% | 13.46% | 12.58% | 0.695 | -14.52% |
| VYM | 44.66% | 13.08% | 12.93% | 0.654 | -14.46% |
January–September 2026: leadership reverses
| ETF | Total return | CAGR | Annual risk | Sharpe | Max drawdown |
|---|---|---|---|---|---|
| SCHD | 21.51% | — | 11.30% | 2.053 | -6.87% |
| VTV | 14.85% | — | 10.37% | 1.498 | -6.35% |
| VYM | 10.06% | — | 10.08% | 0.968 | -6.69% |
CAGR is geometric annualized return; annual risk uses daily-return volatility. The 2026 row reports actual January–September cumulative return without extrapolating a full-year CAGR. Drawdowns include the starting value of each period.
2020 strength, then three years of underperformance
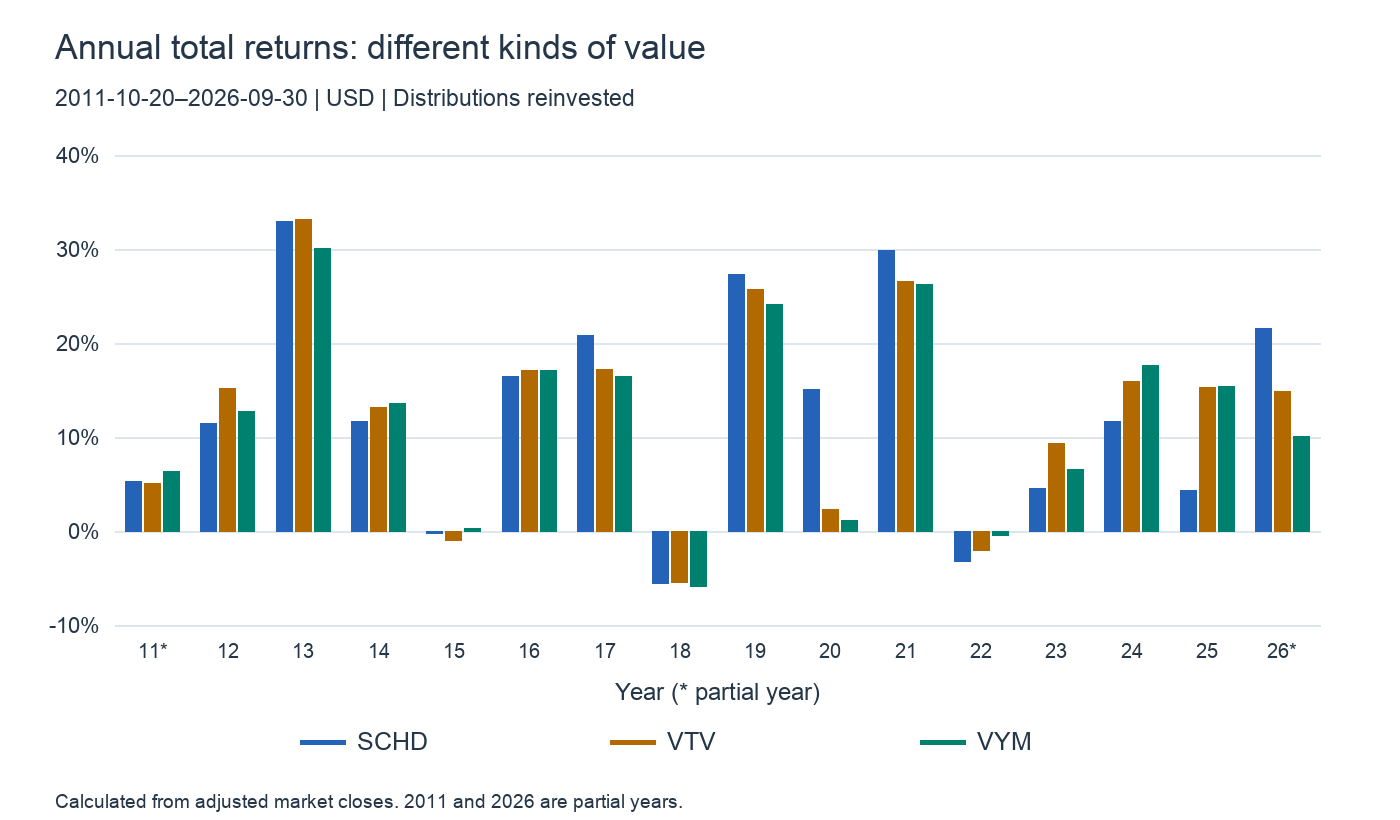
In 2020, SCHD returned 15.03%, versus 2.33% for VTV and 1.14% for VYM. Yet in 2023–2025, SCHD compounded at 6.79%, against 13.46% and 13.08%. Its volatility was higher than both rivals in that period, at 13.49%, and its Sharpe fell to 0.205. A quality-dividend screen is not an automatic route to lower volatility and higher efficiency.
The rules explain why divergence is possible. Yield-based selection can reduce exposure to companies whose rising prices compress their yields. SCHD adds financial and dividend-history filters, so it does not simply capture every company participating in a broad value rally. Selection and weights can help or hinder as leadership changes. This is a structural interpretation of the rules, not a historical stock-by-stock attribution of the performance gap.
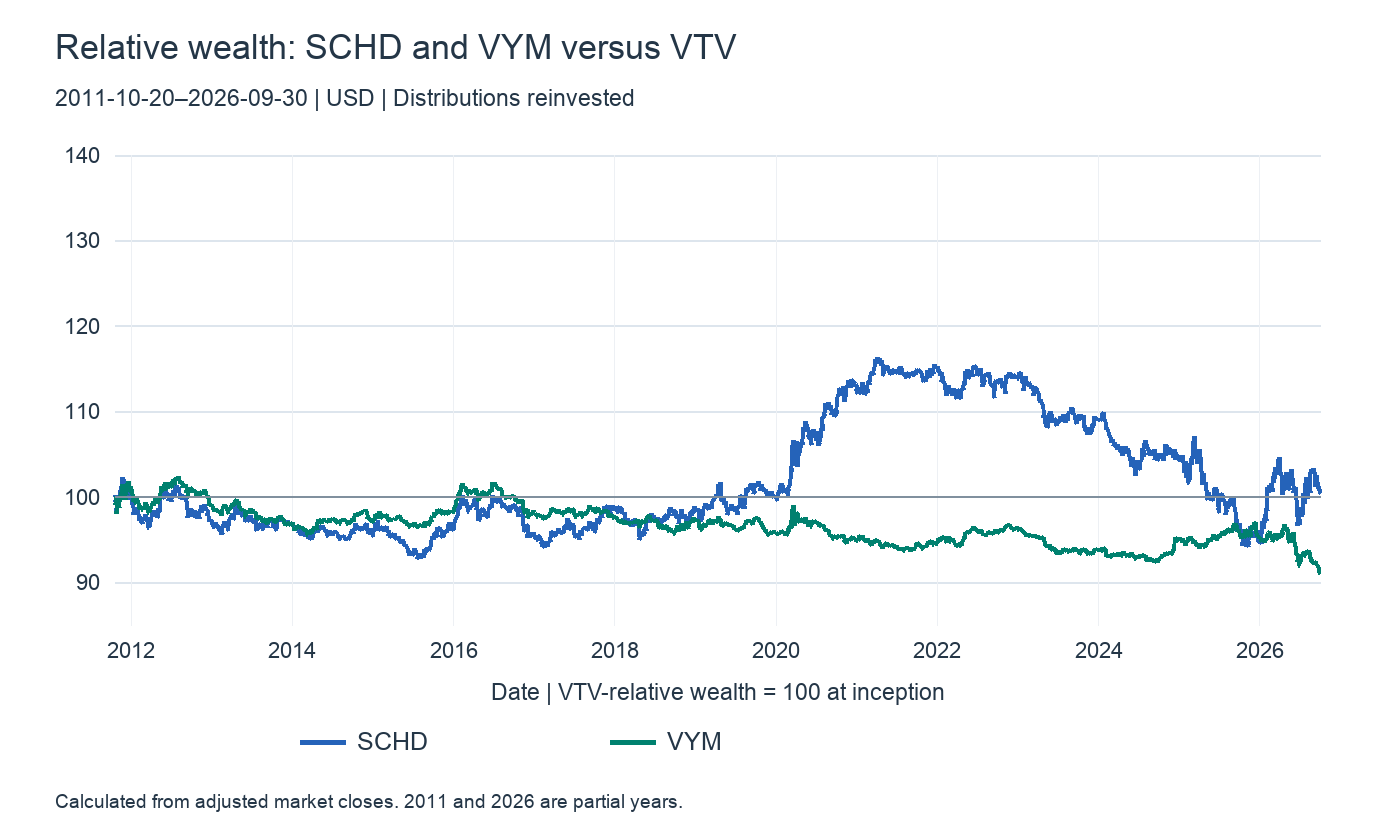
The relative chart divides SCHD or VYM wealth by VTV wealth and rebases the ratio to 100. Rising lines favor the numerator; falling lines favor VTV. SCHD’s advantage expands in 2020–2021 and then contracts. January–September 2026 reverses leadership again: SCHD returns 21.51%, VTV 14.85% and VYM 10.06%. Abandoning a rule after several weak years can mean missing its next favorable stretch.
Dividends do not remove equity drawdowns
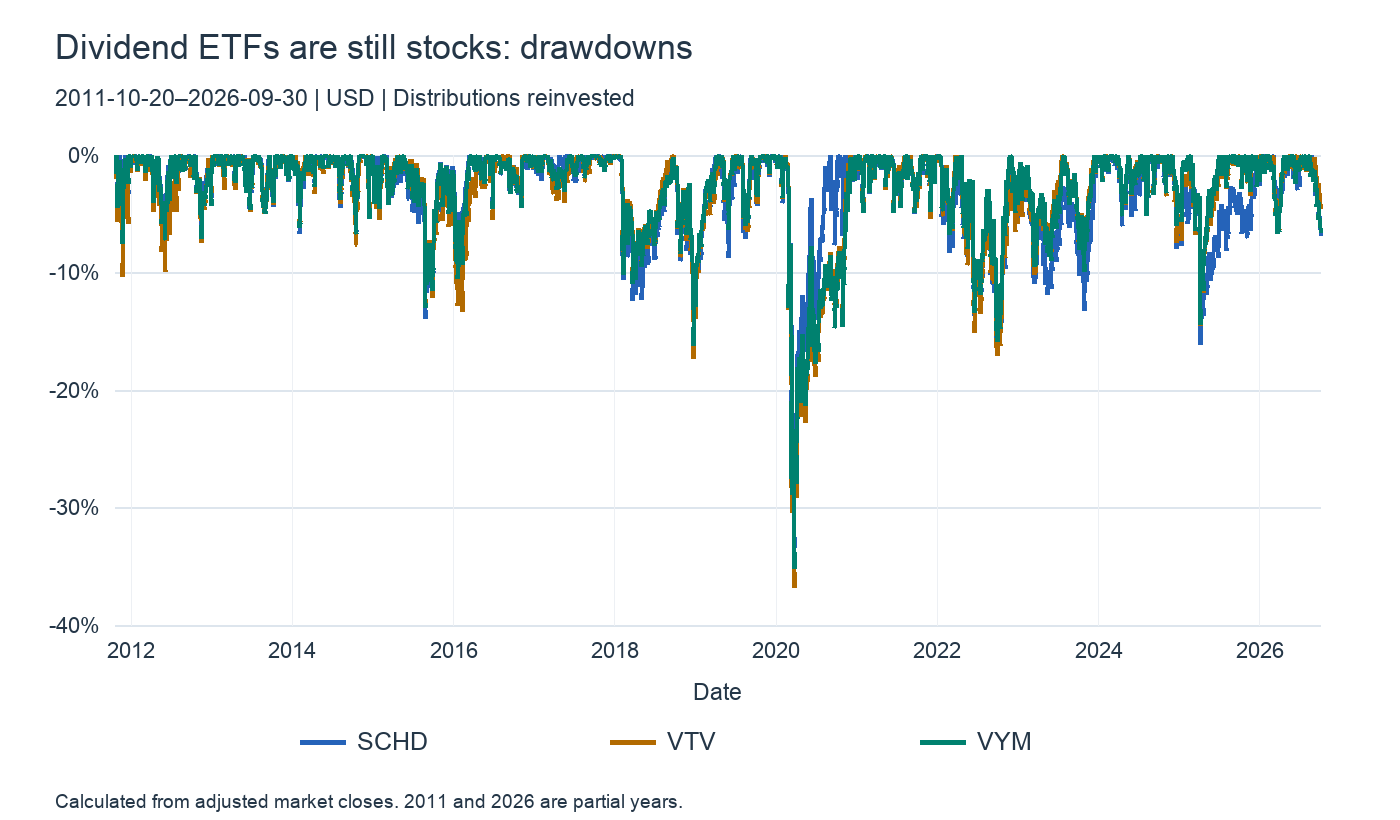
Full-sample maximum drawdowns are −33.37% for SCHD, −36.78% for VTV and −35.21% for VYM. All suffer substantial equity losses. VYM’s −0.43% calendar-year return in 2022 beats SCHD’s −3.26% and VTV’s −2.09%, but this does not make VYM equivalent to cash or bonds.
Daily correlations are 0.957 for SCHD/VTV, 0.967 for SCHD/VYM and 0.988 for VTV/VYM. Combining them changes stock selection more than it changes exposure to the common U.S. equity market. Diversifying distribution characteristics and controlling whole-portfolio drawdowns are different jobs.
Using this board: watch the days they diverge
Place SCHD, VTV and VYM side by side and compare their daily percentage changes. If VTV and VYM move together while SCHD diverges, investigate news affecting its narrower selection. If VYM leads, check its current largest holdings and sector exposures before assigning a cause.
Add VTI to compare dividend/value strategies with the broad U.S. market. Compare percentages over shared trading hours, not nominal share prices or visual slopes. The intraday board is not a distribution-reinvested long-run wealth series, and an ex-dividend price drop is not by itself evidence of investment failure.
My choice depends on the job
VTV fits broad, low-cost large-cap value exposure. VYM fits a broad dividend-yield approach. SCHD fits investors who want dividend history and financial strength to determine a narrower selection. I separate the purpose of a value allocation from the purpose of receiving distributions rather than replacing an existing holding simply because SCHD has become popular.
SCHD has the highest full-sample Sharpe and the lowest 2023–2025 Sharpe. VYM has the lowest full-sample volatility; VTV almost matches SCHD’s wealth growth. The useful question is which selection rule you want to own through its unfavorable periods.
Data and calculation
The baseline is the October 20, 2011 close, with 3,756 common daily returns through September 30, 2026. Yahoo Finance distribution- and split-adjusted market closes provide USD returns with distributions reinvested. No additional contributions or rebalancing between the three ETFs are assumed. SCHD’s 2024 three-for-one split is adjusted.
CAGR uses elapsed calendar days divided by 365.25. Annual risk is sample daily-return standard deviation times √252. Sharpe is mean daily excess return divided by its sample standard deviation, times √252. The risk-free proxy is the previous month’s FRED TB3MS three-month Treasury bill rate, scaled by calendar days between observations divided by 365. TB3MS is a discount-basis yield, used here as a consistent short-rate proxy. Each subperiod’s first return starts at the preceding trading close; missing observations are not interpolated.
Fund expenses are embedded in prices. Personal taxes, commissions and yen-dollar movements are excluded. Japanese mutual funds investing in SCHD have their own fees, taxation and distribution policies, so their yen NAVs are not this U.S. ETF return series. VTV followed an MSCI benchmark until April 2013 and a CRSP benchmark thereafter: these are actual ETF returns, not a backtest applying today’s index rules to its entire history. Calculated and sources checked October 16, 2026.
Data and references
- Berkshire Hathaway — 1989 shareholder letter
- Rakuten — SCHD fund launch, September 2024
- Rakuten — ¥30 billion in assets after 26 days
- SBI — SCHD fund initial subscriptions, December 2024
- Rakuten — Current SCHD mutual-fund range
- Schwab Asset Management — SCHD fund, holdings and performance
- S&P Dow Jones Indices — Dividend index methodology
- Vanguard — VTV factsheet, June 2026
- Vanguard — VYM factsheet, June 2026
- CRSP — Market index methodology and value factors
- Vanguard — July 2026 fund and index name changes
- Yahoo Finance — SCHD adjusted-price history
- Yahoo Finance — VTV adjusted-price history
- Yahoo Finance — VYM adjusted-price history
- FRED — TB3MS short-rate proxy